Fig. 3
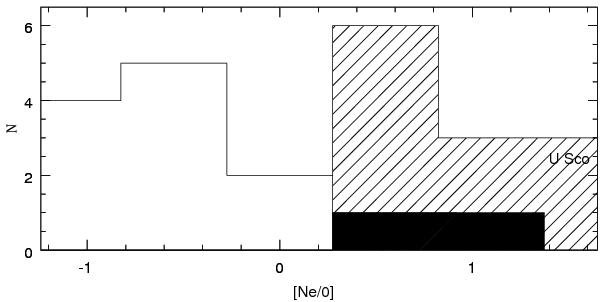
The histogram of the CNe distribution as a function of [Ne/O] abundance. The white area represents the CO novae, the shaded are represents the ONeMg novae, while the black area represents the two CNe which show extreme Ne enrichment but relatively small values for the total heavy elements enrichment. See text for more details.
Current usage metrics show cumulative count of Article Views (full-text article views including HTML views, PDF and ePub downloads, according to the available data) and Abstracts Views on Vision4Press platform.
Data correspond to usage on the plateform after 2015. The current usage metrics is available 48-96 hours after online publication and is updated daily on week days.
Initial download of the metrics may take a while.