Fig. 6
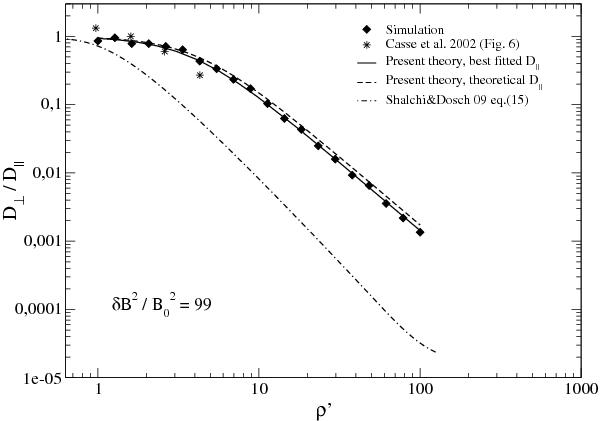
Ratio D⊥/D∥ as a function of ρ′ for η = 0.99, compared to theorectical predictions and other numerical simulations. Filled diamonds: our simulation results. Star symbols: results from Casse et al. 2002. Solid curve: present theoretical prediction with best-fit D∥ from simulations (see Fig. 2). Dashed curve: present theoretical prediction with analytical D∥ = c2/(3νs). Dot-dashed curve: analytical prediction from Shalchi & Dosch (2009), their Eq. (15).
Current usage metrics show cumulative count of Article Views (full-text article views including HTML views, PDF and ePub downloads, according to the available data) and Abstracts Views on Vision4Press platform.
Data correspond to usage on the plateform after 2015. The current usage metrics is available 48-96 hours after online publication and is updated daily on week days.
Initial download of the metrics may take a while.