Fig. A.1
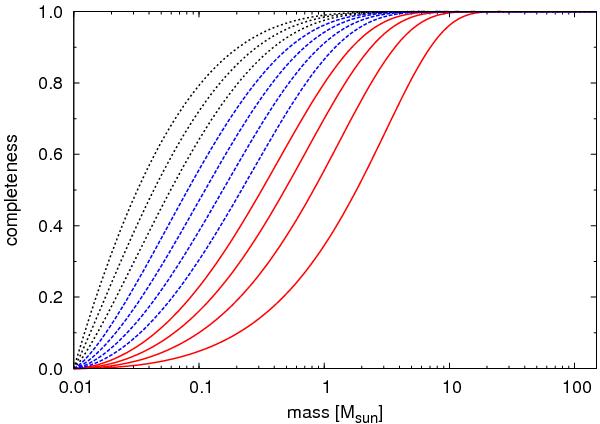
Model of completeness as a function of stellar mass and radial position in the ONC according to Eq. (A.1) and using the parameters from Table A.1. From right to left the graphs represent increasing radii in steps of 0.25 pc from the centre to 2.5 pc, the outer boundary of the ONC. The solid (red), dashed (blue), and dotted (black) lines are grouped in steps of 1 pc, respectively.
Current usage metrics show cumulative count of Article Views (full-text article views including HTML views, PDF and ePub downloads, according to the available data) and Abstracts Views on Vision4Press platform.
Data correspond to usage on the plateform after 2015. The current usage metrics is available 48-96 hours after online publication and is updated daily on week days.
Initial download of the metrics may take a while.