Fig. 4
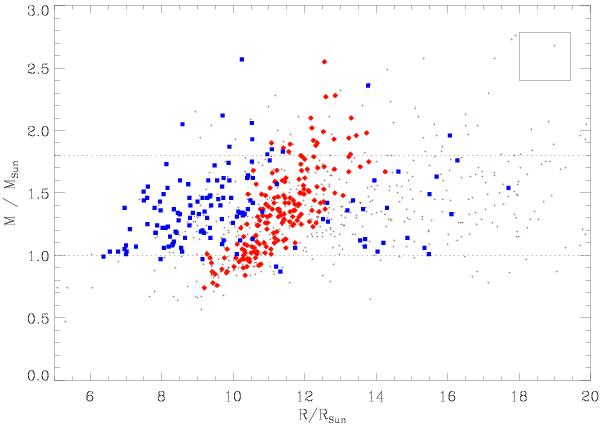
Asteroseismic mass as a function of the asteroseismic radius, with an indication of the evolutionary status derived from the mixed-mode spacing: blue squares for RGB stars, red diamonds for clump stars. Stars without clear measurement of ΔTobs are marked with a small cross. The rectangle indicates the mean 1-σ error bars. The dotted lines at 1 and 1.8 M⊙ correspond to the limits defined in the text.
Current usage metrics show cumulative count of Article Views (full-text article views including HTML views, PDF and ePub downloads, according to the available data) and Abstracts Views on Vision4Press platform.
Data correspond to usage on the plateform after 2015. The current usage metrics is available 48-96 hours after online publication and is updated daily on week days.
Initial download of the metrics may take a while.