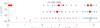
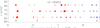
Fig. 3
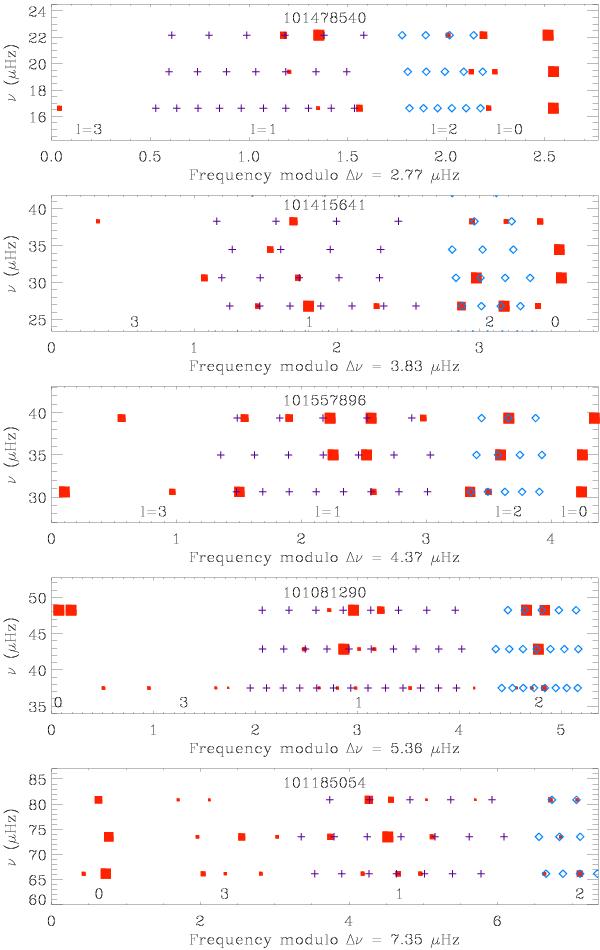
Échelle diagrams around νmax for different targets sorted by increasingly large separations. The red squares indicate the observed peaks, selected with a height-to-background ratio above 6. Dark blue crosses indicate the expected location of the ℓ = 1 mixed modes strictly following the asymptotic expression; light blue diamonds are for ℓ = 2. Similarly to Fig. 1, crosses and diamonds indicate the mean spacing of the mixed modes only, not their exact location.
Current usage metrics show cumulative count of Article Views (full-text article views including HTML views, PDF and ePub downloads, according to the available data) and Abstracts Views on Vision4Press platform.
Data correspond to usage on the plateform after 2015. The current usage metrics is available 48-96 hours after online publication and is updated daily on week days.
Initial download of the metrics may take a while.