Fig. 2
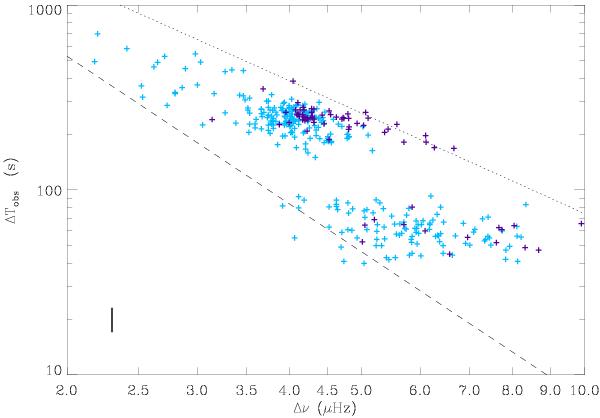
Period separation of mixed modes ΔTobs as a function of the mean frequency separation of the pressure modes ⟨ Δν ⟩ . Blue (purple) crosses represent the targets observed in the center (anticenter) direction. The dashed line indicates the frontier below which the frequency resolution is not fine enough for deriving ΔTobs and the dotted line represents the location of the spurious signature that would correspond to the small separation δν02 (Mosser et al. 2011). The two separate domains correspond to the location of ΔT1 observed by Bedding et al. (2011) and theoretically expected (Montalbán et al., in prep.). The vertical thick line indicates the mean 1-σ error bars (the error bar on the large separation Δν is in fact very small).
Current usage metrics show cumulative count of Article Views (full-text article views including HTML views, PDF and ePub downloads, according to the available data) and Abstracts Views on Vision4Press platform.
Data correspond to usage on the plateform after 2015. The current usage metrics is available 48-96 hours after online publication and is updated daily on week days.
Initial download of the metrics may take a while.