Fig. 1
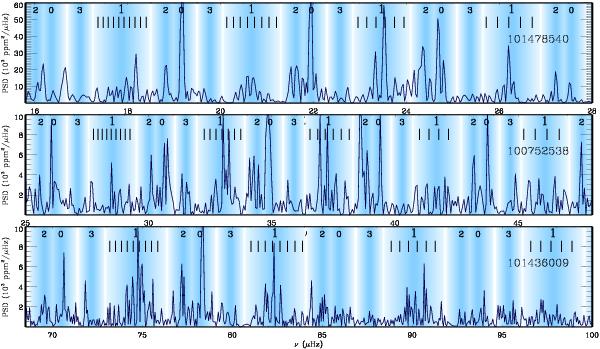
Power density spectra of three CoRoT targets (ID given on the right side), with shaded regions of these bar code spectra that reproduce the universal red-giant oscillation pattern and identify the location of the different harmonic degrees; the denser the background, the higher the probability of having the short-lived p mode realized there. Black dashes in the ℓ = 1 ridges indicate the asymptotic spacing of the mixed modes as derived from Eq. (2). They do not give their exact eigenfrequencies, since the asymptotic relation does not account for the mode bumping of mixed modes.
Current usage metrics show cumulative count of Article Views (full-text article views including HTML views, PDF and ePub downloads, according to the available data) and Abstracts Views on Vision4Press platform.
Data correspond to usage on the plateform after 2015. The current usage metrics is available 48-96 hours after online publication and is updated daily on week days.
Initial download of the metrics may take a while.