Fig. 10
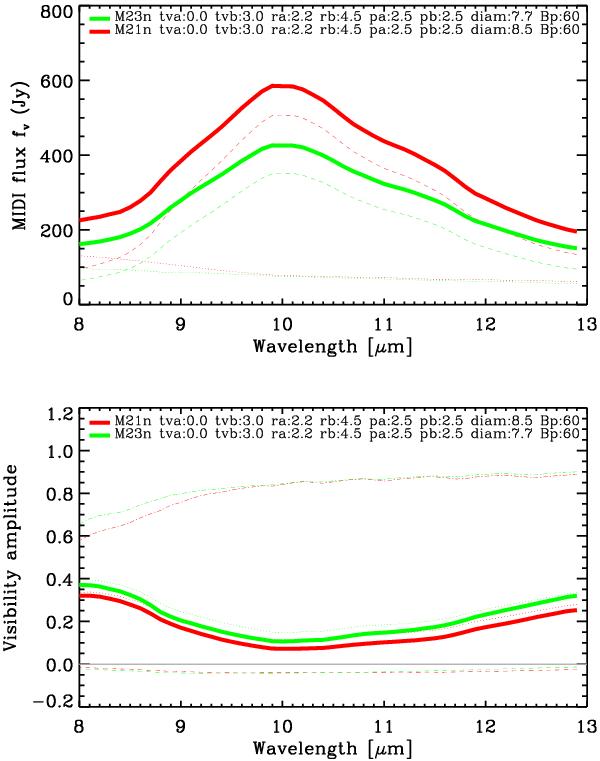
Simulation 1. Synthetic flux (top) and visibility amplitude (bottom) in the wavelength range 8–13 μm. The solid lines represent the global models, the dashed-dotted lines denote the unattenuated stellar contribution i.e. Vstar in Eq. (2), the dotted lines denote the attenuated stellar contribution, and the dashed lines denote the dust shell contributions. This simulation compares two models consisting of the same dust shell parameters but different model atmospheres, the post-maximum model atmosphere M21n (Φmodel = 0.10), and the minimum model atmosphere M23n (Φmodel = 0.30). The photospheric angular diameter is assumed to be larger at post-maximum phase than at minimum phase (8.5 mas compared to 7 mas). The projected baseline length is 60 m. For the exact model parameters, see Table 4. They describe variations around our best-fitting model for RR Aql.
Current usage metrics show cumulative count of Article Views (full-text article views including HTML views, PDF and ePub downloads, according to the available data) and Abstracts Views on Vision4Press platform.
Data correspond to usage on the plateform after 2015. The current usage metrics is available 48-96 hours after online publication and is updated daily on week days.
Initial download of the metrics may take a while.