Fig. 13
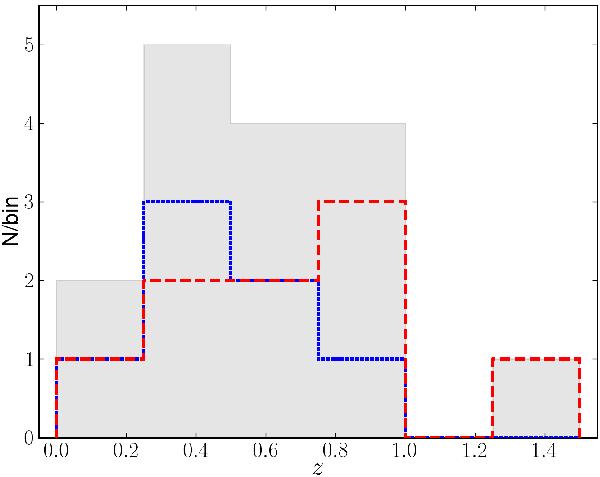
Redshift distribution of the supernovae detected in the SVISS ELAIS-S1 field using a z bin size of 0.25. The redshifts used are the resulting best-fit redshifts from the supernova typing code. The grey, filled bars show the total supernova counts, the blue (dotted) lines show the distribution of thermonuclear SNe and the red (dashed) lines the distribution of core-collapse SNe (this figure is available in colour in the electronic version of the article).
Current usage metrics show cumulative count of Article Views (full-text article views including HTML views, PDF and ePub downloads, according to the available data) and Abstracts Views on Vision4Press platform.
Data correspond to usage on the plateform after 2015. The current usage metrics is available 48-96 hours after online publication and is updated daily on week days.
Initial download of the metrics may take a while.