Fig. 4
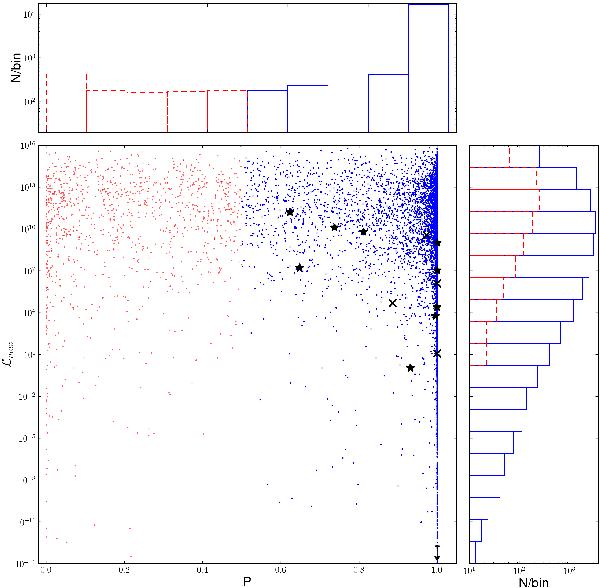
Main panel: fit quality as measured by the absolute Bayesian likelihood for the best-fitting template (ℒmax), versus P, the probability of a given source being of the simulated type, for the ~18 000 Monte-Carlo-simulated supernovae. The upper panel shows the P distribution and the right panel the ℒmax distribution. For clarity, large (blue) dots and solid (blue) lines marks the correctly typed SNe (with P > 0.5); small (red) dots and dashed (red) lines the incorrectly typed SNe. The cross and star symbols in the main panel show ℒmax and P(TN)/P(CC), respectively, for the observed supernovae (see Sect. 5). Three of the thermonuclear SN candidates have ℒmax < 1 × 10-14, they are marked by a caret lower limit symbol at ℒmax < 1 × 10-14 (note that they have the same P(TN) values, thus the symbols are overlapping) (this figure is available in colour in the electronic version of the article).
Current usage metrics show cumulative count of Article Views (full-text article views including HTML views, PDF and ePub downloads, according to the available data) and Abstracts Views on Vision4Press platform.
Data correspond to usage on the plateform after 2015. The current usage metrics is available 48-96 hours after online publication and is updated daily on week days.
Initial download of the metrics may take a while.