Fig. 2
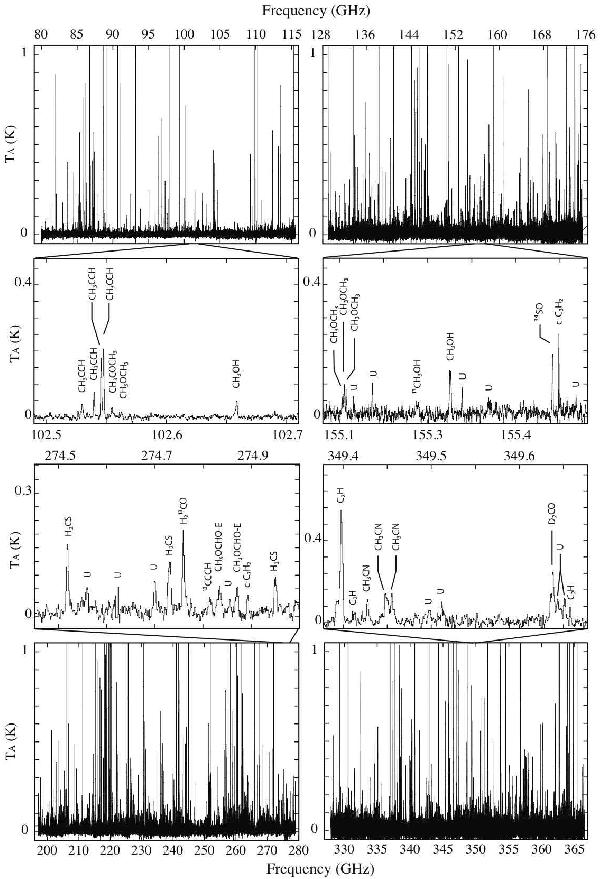
The IRAS 16293 spectra in the four bands of the survey. Upper panels: IRAM-30 m 3 mm and 2 mm bands. Lower panels: IRAM-30 m 1 mm and JCMT-15 m 0.9 mm bands. The middle panels are zoomed views of sample frequency ranges in the four bands respectively. These panels include lines identification based on the publicly available spectral databases (see text for details).
Current usage metrics show cumulative count of Article Views (full-text article views including HTML views, PDF and ePub downloads, according to the available data) and Abstracts Views on Vision4Press platform.
Data correspond to usage on the plateform after 2015. The current usage metrics is available 48-96 hours after online publication and is updated daily on week days.
Initial download of the metrics may take a while.