Fig. 1
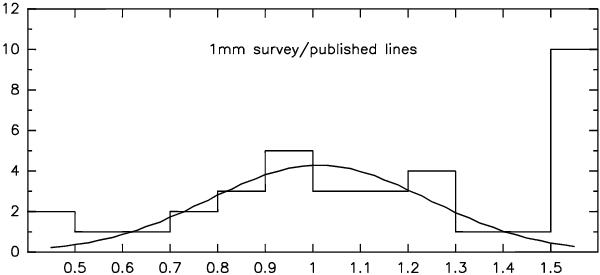
Distribution of integrated intensity ratios of this survey’s 1 mm lines compared to published observations obtained with the IRAM 30 m telescope. The curve is a Gaussian fit to the histogram ruling out the “anomalous” ratios (≤ 0.5 or ≥ 1.5). It can be noticed that the 12 “anomalous” ratios correspond to only 7 “anomalous spectra” among the 165 spectra observed in the 1 mm range.
Current usage metrics show cumulative count of Article Views (full-text article views including HTML views, PDF and ePub downloads, according to the available data) and Abstracts Views on Vision4Press platform.
Data correspond to usage on the plateform after 2015. The current usage metrics is available 48-96 hours after online publication and is updated daily on week days.
Initial download of the metrics may take a while.