Fig. 7
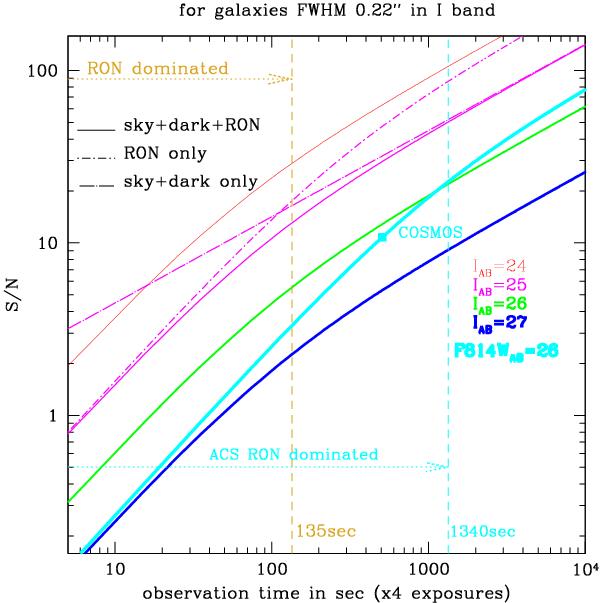
Signal-to-noise ratio as a function of observation time for different I-band magnitudes. The telescope characteristics are listed in Table A.1. We use the I-band filter for the blue, green, magenta, and red curves. The cyan curve uses the properties of the ACS camera in the F814W filter. The square cyan dot on this last curve represents the COSMOS survey with an observation time of 507 s by exposure. The dotted gold line separates the RON (read-out noise) dominated regime (exposure time less than 135 s) from the photon noise dominated regime at longer exposure times. The dotted cyan line represents the same as the dotted gold line for the ACS camera.
Current usage metrics show cumulative count of Article Views (full-text article views including HTML views, PDF and ePub downloads, according to the available data) and Abstracts Views on Vision4Press platform.
Data correspond to usage on the plateform after 2015. The current usage metrics is available 48-96 hours after online publication and is updated daily on week days.
Initial download of the metrics may take a while.