| Issue |
A&A
Volume 531, July 2011
|
|
|---|---|---|
| Article Number | A90 | |
| Number of page(s) | 6 | |
| Section | Extragalactic astronomy | |
| DOI | https://doi.org/10.1051/0004-6361/201116958 | |
| Published online | 20 June 2011 | |
Multi-colour optical variability of the blazar 3C 454.3 in 2007–2010
1
National Astronomical Observatories, Chinese Academy of Sciences, Beijing, 100012, PR China
e-mail: This email address is being protected from spambots. You need JavaScript enabled to view it.
2
Graduate University of Chinese Academy of Sciences, Beijing, 100049, PR China
3
Department of Physics, University of Michigan, Ann Arbor MI, 48109, USA
Received: 25 March 2011
Accepted: 29 April 2011
Abstract
Context. We present our optical multiband (B and R) observations of the blazar 3C 454.3, which were acquired over 30 nights from August 2007 to December 2010.
Aims. We analyse our data to study the optical emission variability properties of 3C 454.3.
Methods. The observations were carried out using both the 1 m EOS Telescope (EST) and the 0.8 m Tsinghua-NAOC Telescope (TNT) simultaneously in most nights at the Xinglong Observatory of National Astronomical Observatories, Chinese Academy of Sciences (NAOC). Both telescopes are equipped with the same type of Princeton Instrument CCD and standard Johnson-Cousin UBVRI filters. To reach a similar signal-to-noise ratio (S/N) in different bands with the same exposure time, observations using the larger diameter EST were carried out with B-band filter, while those of the smaller diameter TNT were carried out with R-band filter. Any time differences between the two telescopes were corrected using GPS. The typical sampling rate was one data point per minute, which is the highest time-resolution so far.
Results. A multi-peak outburst was observed during November–December 2007, in addition to a later outburst during October 27–November 1, 2010. The brightest magnitudes for 3C 454.3 during our observations were B = 13.77 mag and R = 12.69 mag at JD = 2 454 436.0952 (December 1, 2007). One of the most striking events was detected on December 1, 2007, when a flux increase of about 0.67 mag occurred in 3.2 h. A colour analysis shows that the colour variability processes are apparently complex. A bluer-when-brighter trend, a redder-when-brighter trend (generally in faint states), and no significant colour variance were all detected during the outburst of November–December 2007. Furthermore, the kind of “saturation” effect in the B − R trend is not visible in the bright state (R < 14) during August 12–14, 2007. These trends may be due to the interactive contribution from the accretion disc and the jet components. Meanwhile, intra-night variability in B and R bands was found to be correlated, without any time delay exceeding one minute.
Key words: galaxies: active / quasars: general / quasars: individual: 3C 454.3 / galaxies: jets
© ESO, 2011
1. Introduction
Blazars are a subclass of active galactic nuclei (AGNs), whose nature remains unclear. They consist of BL Lacertae (BL Lac) objects and flat-spectrum radio quasars (FSRQs) that are typically flat spectrum radio sources with highly variable and polarized non-thermal continuum emission ranging from radio up to X-ray and often to γ-ray frequencies (Urry & Padovani 1995). The low-energy emission (from the radio to optical bands) consists of synchrotron radiation, while the higher-energy emission (from the X-ray to γ-ray) is likely to be produced by inverse-Compton scattering (Gu et al. 2006; Raiteri et al. 2008b). BL Lacs have a featureless optical continuum, but FSRQs display many strong and broad emission lines (Hu et al. 2006).
Blazars are found to have variability timescales that can be broadly divided into three classes, including micro-variability (also known as intra-night variability), short-term variability, and long-term variability. Significant variations in flux of a few tenths of magnitude on a timescale of tens of minutes to a few hours are generally known as intra-night variability (Wagner & Witzel 1995). Short-term variability can range from weeks to months and long-term variability can have timescales ranging from months to several years (Gupta & Joshi 2005).
The intra-night optical variability (INOV) of blazars has been established for some time (Miller et al. 1989; Carini et al. 1991; Sagar et al. 2004). Although the mechanism(s) of INOV in all AGNs remains inconclusive, for blazars it is commonly related to the non-thermal Doppler-boosted emission from jets (Marscher & Gear 1985; Hughes et al. 1992; Wagner & Witzel 1995). Alternative models including accretion disc instabilities or perturbations (Mangalam & Wiita 1993; Wiita 1996) may also be able to explain some INOV. Nevertheless, the observation of micro-variability on a timescale of hours in FSRQs, which is considered to be a strong discriminator between accretion disks and relativistic jet models of these sources, is also a logical way of exploring the structure and physical conditions near the nucleus. Although monitoring campaigns have been performed at all wavelengths for a limited number of objects, the many parameters involved in physical models of emission mechanisms have not been tightly constrained (Vagnetti et al. 2003). Thus, there is a need to collect data over relatively long observing periods to monitor multiband variability limited to the optical range.
The blazar 3C 454.3 (PKS 2251+158; z = 0.859; Vercellone et al. 2008) is one of the most active FSRQs, which has been observed at almost all available wavelengths, from radio to γ-rays. From 1966, its long-term optical and radio observations were carried out by Villata et al. (2006). In 2005, major flaring activity was detected in 3C 454.3 in almost all energy bands (Giommi et al. 2006); in particular, 3C 454.3 had its historical maximum at optical wavelengths with R = 12.0 on May 9 (Fuhrmann et al. 2006; Villata et al. 2006; Raiteri et al. 2008b). After a period of relative quiescence in 2006–2007, the source again displayed a strong optical outburst in July 2007, reaching R = 12.8 (Vercellone et al. 2008). Soon after that in November, another significant outburst was detected by the Astro-rivelatore Gamma a Immagini LEggero (AGILE) (Chen et al. 2007; Pucella et al. 2007), which triggered intensive monitoring by the Whole Earth Blazar Telescope (WEBT) (Raiteri et al. 2008a).
We present our data for a multiband optical monitoring program of 3C 454.3 from August 12, 2007 to December 29, 2010 with the EST and TNT at Xinglong Observatory of NAOC. The paper is arranged as follows: Sect. 2 describes observations and data analysis method, Sect. 3 presents the results and discussion, and the conclusions of the present work are reported in Sect. 4.
2. Observations and data reduction
The simultaneous photometric observations of the blazar 3C 454.3 in Johnson-Cousin B and R passbands were carried out using the EST and TNT. The EST has alt-azimuth mounted, Ritchey-Chrétien optics designed with dual Nasmyth focal positions, and its focal ratio is f/8, while TNT is an equatorial-mounted Cassegrain system with a f/10 beam. The two telescopes use the same type of Princeton Instrument 1340 × 1300 thin back-illuminated CCD, which has a pixel size of ~20 μm and is liquid-nitrogen cooled. The read-out noise and gain of the CCD are 5 electrons and 2.3 electrons/ADU, respectively. The entire CCD chip covers ~11 × 11 arcmin2 of the sky for both of the telescopes and they are equipped with the same set of standard Johnson-Cousin UBVRI filters. In general, the quantum efficiencies of the CCDs in the R-band is much higher than in the B-band. To reach similar S/N in the same exposure time, namely to make the overall efficiency of EST approximately equal to TNT, the larger diameter EST was carried out with the B-band filter, while the smaller diameter TNT was carried out with the R-band filter.
Simultaneous multiband photometric observations help to guarantee that the detected emissions are emitted at the same time from various zones of the source. This could also help us to explain our data and perhaps constrain mechanism parameters, because it is possible to make unambiguous estimates about the variability mechanisms based on the light curve shapes and timescales.
To ensure that the multiband observations were synchronized, the start time of the observations was set at the exact beginning of each minute, and the time between the two telescopes was pre-adjusted by GPS before starting the observations. The exposure time was set to be 40 s with an additional 20 s readout time, which gives a typical sampling rate of 1 point per minute. This time-resolution is much higher than previous work that had a general timescale of tens of minutes or a few hours in the published papers (Fuhrmann et al. 2006; Giommi et al. 2006; Hu et al. 2006; Gupta et al. 2008; Bonning et al. 2009; Pacciani et al. 2010). 3C 454.3 was monitored as continuously as possible in each observation night, and the accumulated error of time did not exceed two seconds during the whole night of observation. Overall, 3C 454.3 was monitored in 32 clear nights throughout the observing run (see Table 1).
The complete log of observations of 3C 454.3 with BR filter.
Sky flat-field images and bias frames were routinely obtained by the night assistants during dusk or dawn when available. CCD cameras were cooled sufficiently to ensure that no dark frame was needed. The image reduction (including bias subtraction and flat-field correction) was performed with standard procedures using the IRAF1 software. Differential aperture photometry was applied with the APPHOT package in IRAF by setting varying apertures according to the FWHM. The typical average seeing (FWHM of stellar image) was ~ 2.3 arcsec ranging from 1.8 to 3.0 arcsec. An auto photometry package (AUTOPHOT) was developed to minimize the repetition. The overall average error rms of photometry was not more than 0.01 mag.
3. Results and discussion
3.1. Light curves
Over the whole 2007–2010 observing seasons, the 3C 454.3 underwent several different phases of strong activity, which were intensively monitored in the B and R bands by the EST and TNT. We detected noticeable episodes of rapid variability, involving flux changes of several tenths of mag in a few hours (intra-night timescales). The overall B and R bands light curves obtained from August 12, 2007 to December 29, 2010 are plotted together in Fig. 1 with a total of 8072 data points. The maximum magnitude variations are △ B = 2.81 mag and △ R = 2.82 mag.
According to Raiteri et al. (2008b) and Sasada et al. (2010), there was an outburst state from JD = 2 454 270 to 2 454 345. We started the monitoring at JD = 2 454 325 (August 12, 2007), and a short flare was observed on JD = 2 454 327 (Fig. 2), including a flux increase of about 0.19 mag in 2.7 h and a 0.14 mag brightness decrease in 1.3 h. A faint state was subsequently detected since JD = 2 454 364, where B decreased from 16.16 mag to 16.56 mag and simultaneously R decreased from 15.02 mag to 15.46 mag within 4 days.
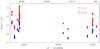 |
Fig. 1 Multiband light curves of 3C 454.3 at B (blue filled circles) and R (red filled circles) bands from EST and TNT. |
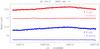 |
Fig. 2 Multiband light curves of 3C 454.3 at B (blue filled circles) and R (red filled circles) bands from EST and TNT on August 14, 2007 (JD = 2 454 327.1854–2 454 327.3514). One of the reference star’s light curves at B (blue crosses) and R (red crosses) bands are also plotted for comparison purpose. Errors are not more than 0.01 mag, thus are omitted for clarity. |
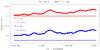 |
Fig. 3 Similar to Fig. 2, but with time on November 30, 2007 (JD = 2 454 434.9479–2 454 435.1035). |
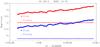 |
Fig. 4 Similar to Fig. 2, but with time on December 1, 2007 (JD = 2 454 435.9632–2 454 436.0952). |
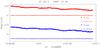 |
Fig. 5 Similar to Fig. 2, but with time on December 2, 2007 (JD = 2 454 436.9521–2 454 437.0945). |
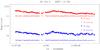 |
Fig. 6 Similar to Fig. 2, but with time on December 3, 2007 (JD = 2 454 437.9507–2 454 438.0848). |
Figures 3–6 show the B and R bands light curves during the core outburst period, from November 30 to December 3, 2007. Fig. 3 shows a well-sampled fluctuant brightening of 0.32 mag in 3.7 h detected on November 30, 2007. The most striking event was detected on December 1 (JD = 2 454 435.9632–2 454 436.0952) with a flux increase of about 0.67 mag in 3.2 h, which is displayed in Fig. 4. This is one of the strongest and most rapid variations ever observed in blazars (Raiteri et al. 2008a). Subsequently, Fig. 5 shows a decrease of about 0.27 mag in 3.4 h detected on December 2, and Fig. 6 shows the flux variations involving a 0.23 mag dimming in 3.2 h detected on December 3.
We found the brightest magnitudes of 3C 454.3 during our observations were B = 13.77 mag and R = 12.69 mag detected on December 1, 2007. According to the observation by Raiteri et al. (2008b), it was brighter at R = 12.58 at UT = 15:08 on December 1 (JD = 2 454 436.1284). Unfortunately, the altitude of 3C 454.3 decreased to below 30 degrees after UT = 14:20, which is the horizon limitation for TNT at the Xinglong Observatory of NAOC. We therefore had to stop the observation so the maximum peak was not observed.
From autumn 2009, only TNT was used to monitor 3C 454.3 in B and R bands by turns due to technique maintenance and repair on EST. The source was stable at R = 15.47 ± 0.03 (B = 16.49 ± 0.03) in November 6–7, 2009. After the noticeable outburst in December 2009 reported by Pacciani et al. (2010), remarkable episodes with very fast variability were monitored from October 26 to November 1, 20102. The object became brighter in late October. It was detected at R ~ 14.8 (B ~ 15.9) on October 27, 2010 (JD = 2 455 496), and gradually brightened over the following 5 days, until it reached B = 14.91 mag and R = 13.58 mag on November 1, 2010 (JD = 2 455 502.1792) (Fig. 7). These optical variations were observed when the source was in remarkably bright states.
We suggest that the noticeable outburst is most likely to be a real variation in the jet emission. The shock-in-jet model is well accepted to explain microvariability in radio-loud AGNs. The model suggests that the relativistic particle jets ejected by black holes cause their flux to be variable even on the timescales of less than an hour (Gupta & Joshi 2005). Meanwhile, changes in the viewing angle of the jet with respect to the line of sight could cause temporal changes in the Doppler factor (Fuhrmann et al. 2006).
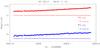 |
Fig. 7 Similar to Fig. 2, but with time on November 1, 2010 (JD = 2 455 501.9163–2 455 502.1814). |
3.2. Correlated variability
It is well known that the determination of time lag between two sets of data in different wavebands can be used to study the conditions in the inner regions of blazars. The existence of time lags is apparent from a close inspection of the light curves in most cases. The time lag can be searched for using the discrete correlation function (DCF) (Edelson & Krolik 1988; Hufnagel & Bregman 1992). If the two data sets are taken simultaneously (at the same time and for samples of similar size), unbinned discrete correlations (UDCF) between these two data sets can be defined to be 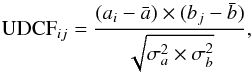 (1)where \begin{formule}$a_{i}$\end{formule} and bj are points in the data sets,
  and
and  are the average values of the data sets, and σa and σb are the standard deviations in each data set.
3C 454.3 was observed in B and R bands continuously and intensively on August 14, November 30, December 1 and December 2 in 2007, for 4.0, 3.7, 3.2 and 3.4 h, respectively, which makes it possible for us to discuss the correlated variability at higher time-resolution in these four segments of data.
Figure 8 shows that the B-band variation is nicely correlated with the R-band variation, indicating no time delay longer than 1 min between B and R bands among the 4 nights. This coincidence of the B and R bands variations testifies that the radiation in both wavebands may have the similar (synchrotron) nature in active states, and arise from the same region in the jet.
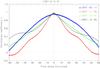 |
Fig. 8 UDCFs between B and R bands light curves on August 14 (blue filled circles), November 30 (red filled squares), December 1 (green filled triangles), and December 2 (black crosses) in 2007. Error bars are omitted for clarity. The UDCFs peak at zero lag, and the corresponding correlation coefficient is r = 0.955 (August 14), 0.982 (November 30), 0.993 (December 1), and 0.981 (December 2), respectively. |
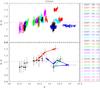 |
Fig. 9 The B − R colour indices as a function of R magnitudes during the 26 nights in the right list. The top panel contains 4030 colour index points. To clarify the colour variability, in the bottom panel the |


Some results at other wavelengths have also been reported. For instance, an upper limit lag of about 1 day between IR/optical and gamma-ray fluxes has been reported (Bonning et al. 2009; Vercellone et al. 2010), while a possible delay between the gamma-ray and the optical is constrained to within 12 h (Donnarumma et al. 2009; Vercellone et al. 2009). An analysis of the X-ray and optical correlation found that variations at the two wavelengths are simultaneous to within one day (Jorstad et al. 2010). However, the time lags between different radio frequencies are diverse because the radio emission may come from a larger region. The perturbation may come from different orientation of the radio emitting region, and appear to travel along the inhomogeneous jet, causing the timescales to be shortened even more when the viewing angle is smaller (Villata et al. 2007).
3.3. Colour analysis
A colour analysis can be an important tool for studying the optical variation behaviour of the source and the nature of its emission. Figure 9 shows the B − R colour indices as a function of R magnitudes for 3C 454.3. The average value is 1.11 mag with a standard deviation of 0.07 mag. The colour indices were calculated by selecting both B and R data points with errors not greater than 0.02 mag, and by coupling B and R data taken by EST and TNT at the same time in most cases.
From Fig. 9, we note that the colour-magnitude relationship in a faint state is different from that in the outburst state. A general redder-when-brighter trend was found in faint states, which seems to “saturate” for R ~ 14. In addition, some brightest states of the outburst (R < 14) showed a bluer-when-brighter trend. Similar results were reported by Villata et al. (2006) for the earlier outbursts observed with WEBT. We note that the trends are partially consistent with the analysis of WEBT 2007–2008 data by Raiteri et al. (2008b). This can be caused by the superposition of two emission components, including a “red” contribution due to synchrotron radiation from the jet and a “blue” contribution due to thermal radiation from the accretion disc (Raiteri et al. 2008b). The redder-when-brighter trend in the faint state may result from the increase in the contribution of the synchrotron emission relative to the thermal emission, when the source is brightening. In other words, the dominant component from the jet is variable, while the other component from the disc is not necessarily so. When the source is brighter than R ~ 14 mag, a bluer-when-brighter trend is detected in our observation. This is consistent with the common trend for blazars, which usually have a bluer-when-brighter chromatism when they are in active states (Gu et al. 2006; Wu et al. 2007). The high and fast INOV in active states can be determined by a “strongly-chromatic” short-term component, which may be caused by intrinsic phenomena, such as particle acceleration from shock-in-jet events (Villata et al. 2004).
However, in some brightest states of the outburst (R < 14), this “saturation” effect in the B − R trend is not visible. Fig. 9 shows that the colour on August 14, 2007 was significantly redder than on August 12, 2007, which differs from the bluer-when-brighter trend for R < 14. Furthermore, Fig. 10 shows that the colour-magnitude relation is apparently complex in the November 30–December 5, 2007 outburst (bottom panel), compared with the R-band light curve (top panel). The source rapidly brightened both on November 30 and December 1, but no significant colour variance was found. The object faded rapidly from December 2 to December 5, tracing a bluer-when-brighter trend for R < 14, except for December 3, which indicates a redder-when-brighter trend. In addition, the time evolution of the B − R colour index during the October 27–November 1, 2010 optical outburst is compared in Fig. 11 (bottom panel) with the R-band light curve (top panel). In our observation, 3C 454.3 generally exhibited a redder-when-brighter trend, even when R < 14 mag on November 1, which is also opposite to the bluer-when-brighter trend. To summarize, the colour variation implies that there is a general redder-when-brighter trend in the active state even when R < 14 mag, as found by Sasada et al. (2010). The irregular variations are probably all consistent with the predictions of the shock-in-jet model (Wu et al. 2007). This may be interpreted as the interplay of different emission components. The high-temporal-density presently optical datasets available partially confirm previous studies leading to a more precise scenario, but also bring new interesting questions.
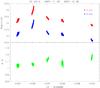 |
Fig. 10 The B and R bands light curves during the November 30–December 5, 2007 outburst (top panel) are shown together with the corresponding B − R colour indices (bottom panel) as a function of time. Error bars are omitted for clarity. |
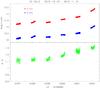 |
Fig. 11 Similar to Fig. 10 but with time from October 27 to November 1, 2010. |
4. Conclusions
We have presented our extensive simultaneous (△ t < 1 min) optical photometric datasets of the blazar 3C 454.3 collected in the B and R bands by the EST and TNT in August 2007–December 2010. These data show several active states on intra-night timescales. The main results can be summarized as follows:
-
We have detected optical outbursts inNovember–December 2007 andOctober–November 2010, and some other active events. Thesource displayed strong variability with amplitudes >2.80 mag over the whole 2007–2010 observing seasons. Both a rapid brightening with a rising rate of ~0.2 mag per hour and the brightest level (B = 13.77 mag, R = 12.69 mag) were found on December 1, 2007. The latest outburst was detected during October 27–November 1, 2010, including a flux increase of about △ B = 1.02 mag and △ R = 1.24 mag within six days. The outbursts may have resulted from changes in the Doppler beaming factor.
-
Our data, characterized by very high temporal resolution and simultaneous measurements, show no time delay exceeding one minute between variations in the B and R bands.
-
We detected a bluer-when-brighter trend in some bright parts of the outburst (R < 14) and a redder-when-brighter trend in the faint state (R > 14). However, in some bright parts of the outburst (R < 14), the kind of “saturation” in the B − R trend is not found. To summarize, colour variability processes are apparently complex. These trends may be interpreted as the interplay of different emission components.
We conclude that, the synchronized use of two telescopes could greatly improve the temporal resolution to help us monitor the outbursts of the source. However, it is not easy to differentiate between the contribution mechanisms for the non-thermal and the thermal components using optical data alone. Additional multi-frequency monitoring is still needed to follow the future phases of 3C 454.3, which is one of the most active FSRQs observed since 2005.
IRAF is distributed by NOAO, which is operated by AURA, Inc., under cooperative agreement with NSF.
Unfortunately, the maximum emission (on November 20, 2010; Striani et al. 2010a; Sanchez & Escande 2010; Striani et al. 2010b,c) was not monitored in our observation because the telescope observation time had been allocated to other projects selected and assigned by a single time allocation committee.
Acknowledgments
We thank the referee, Gianluca Pucella, for useful comments and suggestions. The authors are grateful to Wan Zhou, Chunlan Lu, Jiupeng Guo, Fengfeng Mi, Liang Ma and Liguo Fang for their night assistant work. We are thankful to Pingping Liu (Chinese Academy of Sciences, China) for stimulating discussions that helped us to improve this paper. This work was supported by the Chinese Natural Science Foundation (No. 10803008). It was also supported by the National Basic Research Program of China – 973 Program (2009CB824800).
References
- Bonning, E. W., Bailyn, C., Urry, C. M., et al. 2009, ApJ, 697, L81 [NASA ADS] [CrossRef] [Google Scholar]
- Carini, M. T., Miller, H. R., Noble, J. C., & Sadun, A. C. 1991, AJ, 101, 1196C [NASA ADS] [CrossRef] [Google Scholar]
- Chen, A., Miller, H. R., Noble, J. C., & Sadun, A. C. 2007, The Astronomer’s Telegram, 1278, 1 [Google Scholar]
- Donnarumma, I., Pucella, G., Vittorini, V., et al. 2009, ApJ, 707, 1115 [NASA ADS] [CrossRef] [Google Scholar]
- Edelson, R. A., & Krolik, J. H. 1988, ApJ, 333, 646 [NASA ADS] [CrossRef] [Google Scholar]
- Fuhrmann, L., Cucchiara, A., Marchili, N., et al. 2006, A&A, 445, L1 [NASA ADS] [CrossRef] [EDP Sciences] [Google Scholar]
- Giommi, P., Blustin, A. J., Capalbi, M., et al. 2006, A&A, 456, 911 [NASA ADS] [CrossRef] [EDP Sciences] [Google Scholar]
- Gu, M. F., Lee, C.-U., Pak, S., Yim, H. S., & Fletcher, A. B. 2006, A&A, 450, 39 [NASA ADS] [CrossRef] [EDP Sciences] [Google Scholar]
- Gupta, A. C., & Joshi, U. C. 2005, A&A, 440, 855 [NASA ADS] [CrossRef] [EDP Sciences] [Google Scholar]
- Gupta, A. C., Alok, C., Fan, J. H., Bai, J. M., & Wagner, S. J. 2008, AJ, 135, 1384 [NASA ADS] [CrossRef] [Google Scholar]
- Hu, S. M., Zhao, G., Guo, H. Y., Zhang, X., & Zheng, Y. G. 2006, MNRAS, 371, 1243 [NASA ADS] [CrossRef] [Google Scholar]
- Hufnagel, B. R., & Bregman, J. N. 1992, ApJ, 386, 473 [NASA ADS] [CrossRef] [Google Scholar]
- Hughes, P. A., Aller, H. D., & Aller, M. F. 1992, ApJ, 396, 469 [NASA ADS] [CrossRef] [Google Scholar]
- Jorstad, S. G., Marscher, A. P., Larionov, V. M., et al. 2010, ApJ, 715, 362 [NASA ADS] [CrossRef] [Google Scholar]
- Mangalam, A. V., & Wiita, P. J. 1993, ApJ, 406, 420 [NASA ADS] [CrossRef] [Google Scholar]
- Marscher, A. P., & Gear, W. K. 1985, ApJ, 298, 114 [NASA ADS] [CrossRef] [Google Scholar]
- Miller, H. R., Carini, M. T., & Goodrich, B. D. 1989, Nature, 337, 627 [NASA ADS] [CrossRef] [Google Scholar]
- Pacciani, L., Vittorini, V., Tavani, M., et al. 2010, ApJ, 716, L170 [NASA ADS] [CrossRef] [Google Scholar]
- Pucella, G., Tavani, M., D’Ammando, F., et al. 2007, The Astronomer’s Telegram, 1300, 1 [Google Scholar]
- Raiteri, C. M., Villata, M., Chen, W. P., et al. 2008a, A&A, 485, L17 [NASA ADS] [CrossRef] [EDP Sciences] [Google Scholar]
- Raiteri, C. M., Villata, M., Larionov, V. M., et al. 2008b, A&A, 491, 755 [NASA ADS] [CrossRef] [EDP Sciences] [Google Scholar]
- Sagar, R., Villata, M., Larionov, V. M., et al. 2004, MNRAS, 348, 176 [NASA ADS] [CrossRef] [Google Scholar]
- Sanchez, D., & Escande, L. 2010, The Astronomer’s Telegram, 3041, 1 [NASA ADS] [Google Scholar]
- Sasada, M., Uemura, M., Arai, A., et al. 2010, PASJ, 62, 645S [NASA ADS] [CrossRef] [Google Scholar]
- Striani, E., Lucarelli, F., Vercellone, S., et al. 2010a, The Astronomer’s Telegram, 3034, 1 [NASA ADS] [Google Scholar]
- Striani, E., Vercellone, S., Lucarelli, F., et al. 2010b, The Astronomer’s Telegram, 3043, 1 [NASA ADS] [Google Scholar]
- Striani, E., Vercellone, S., Tavani, M., et al. 2010c, The Astronomer’s Telegram, 3049, 1 [NASA ADS] [Google Scholar]
- Urry, C. M., & Padovani, P. 1995, PASP, 107, 803 [NASA ADS] [CrossRef] [Google Scholar]
- Vagnetti, F., Trevese, D., & Nesci, R. 2003, ApJ, 590, 123 [NASA ADS] [CrossRef] [Google Scholar]
- Vercellone, S., Chen, A. W., Giuliani, A., et al. 2008, ApJ, 676, L13 [NASA ADS] [CrossRef] [Google Scholar]
- Vercellone, S., Chen, A. W., Vittorini, V., et al. 2009, ApJ, 690, 1018 [NASA ADS] [CrossRef] [Google Scholar]
- Vercellone, S., D’Ammando, F., Vittorini, V., et al. 2010, ApJ, 712, 405 [NASA ADS] [CrossRef] [Google Scholar]
- Villata, M., Raiteri, C. M., Kurtanidze, O. M., et al. 2004, A&A, 421, 103 [NASA ADS] [CrossRef] [EDP Sciences] [Google Scholar]
- Villata, M., Raiteri, C. M., Balonek, T. J., et al. 2006, A&A, 453, 817 [NASA ADS] [CrossRef] [EDP Sciences] [Google Scholar]
- Villata, M., Raiteri, C. M., Aller, M. F., et al. 2007, A&A, 464, L5 [NASA ADS] [CrossRef] [EDP Sciences] [Google Scholar]
- Wagner, S. J., & Witzel, A. 1995, ARA&A, 33, 163, 97 [NASA ADS] [CrossRef] [Google Scholar]
- Wiita, P. J. 1996, ASPC, 110, 42W [Google Scholar]
- Wu, J., Zhou, X., Ma, J., et al. 2007, AJ, 133, 1599 [NASA ADS] [CrossRef] [Google Scholar]
All Tables
All Figures
|
Fig. 1 Multiband light curves of 3C 454.3 at B (blue filled circles) and R (red filled circles) bands from EST and TNT. |
| In the text | |
|
Fig. 2 Multiband light curves of 3C 454.3 at B (blue filled circles) and R (red filled circles) bands from EST and TNT on August 14, 2007 (JD = 2 454 327.1854–2 454 327.3514). One of the reference star’s light curves at B (blue crosses) and R (red crosses) bands are also plotted for comparison purpose. Errors are not more than 0.01 mag, thus are omitted for clarity. |
| In the text | |
|
Fig. 3 Similar to Fig. 2, but with time on November 30, 2007 (JD = 2 454 434.9479–2 454 435.1035). |
| In the text | |
|
Fig. 4 Similar to Fig. 2, but with time on December 1, 2007 (JD = 2 454 435.9632–2 454 436.0952). |
| In the text | |
|
Fig. 5 Similar to Fig. 2, but with time on December 2, 2007 (JD = 2 454 436.9521–2 454 437.0945). |
| In the text | |
|
Fig. 6 Similar to Fig. 2, but with time on December 3, 2007 (JD = 2 454 437.9507–2 454 438.0848). |
| In the text | |
|
Fig. 7 Similar to Fig. 2, but with time on November 1, 2010 (JD = 2 455 501.9163–2 455 502.1814). |
| In the text | |
|
Fig. 8 UDCFs between B and R bands light curves on August 14 (blue filled circles), November 30 (red filled squares), December 1 (green filled triangles), and December 2 (black crosses) in 2007. Error bars are omitted for clarity. The UDCFs peak at zero lag, and the corresponding correlation coefficient is r = 0.955 (August 14), 0.982 (November 30), 0.993 (December 1), and 0.981 (December 2), respectively. |
| In the text | |
|
Fig. 9 The B − R colour indices as a function of R magnitudes during the 26 nights in the right list. The top panel contains 4030 colour index points. To clarify the colour variability, in the bottom panel the |
| In the text | |
|
Fig. 10 The B and R bands light curves during the November 30–December 5, 2007 outburst (top panel) are shown together with the corresponding B − R colour indices (bottom panel) as a function of time. Error bars are omitted for clarity. |
| In the text | |
|
Fig. 11 Similar to Fig. 10 but with time from October 27 to November 1, 2010. |
| In the text | |
Current usage metrics show cumulative count of Article Views (full-text article views including HTML views, PDF and ePub downloads, according to the available data) and Abstracts Views on Vision4Press platform.
Data correspond to usage on the plateform after 2015. The current usage metrics is available 48-96 hours after online publication and is updated daily on week days.
Initial download of the metrics may take a while.