Fig. 9
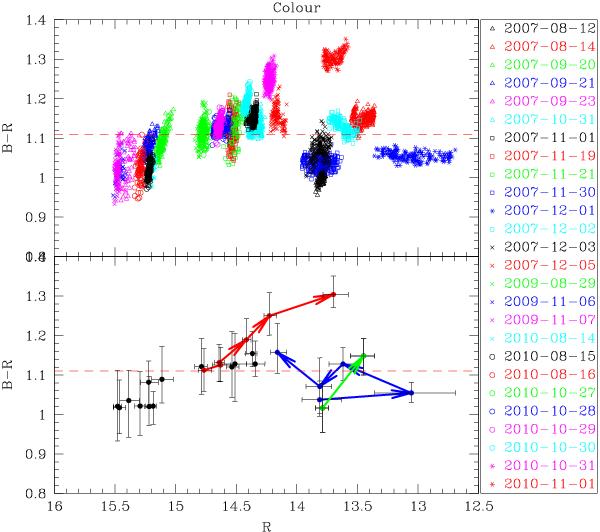
The B − R colour indices as a function of R magnitudes during the 26 nights in the right list. The top panel contains 4030 colour index points. To clarify the colour variability, in the bottom panel the  and
and  values in each night are reported instead of the dense points, while the bars indicate the variable range of B − R and R. The August 2007 active state, the late November 2007 outburst and the late October 2010 outburst states are indicated by the green, blue, and red solid lines connecting the colour indices, respectively. The arrows indicate the time sequence. In both panels, the red dashed lines indicate the average B − R colour index (1.11). Error bars are omitted for clarity.
Current usage metrics show cumulative count of Article Views (full-text article views including HTML views, PDF and ePub downloads, according to the available data) and Abstracts Views on Vision4Press platform.
Data correspond to usage on the plateform after 2015. The current usage metrics is available 48-96 hours after online publication and is updated daily on week days.
Initial download of the metrics may take a while.