Fig. 8
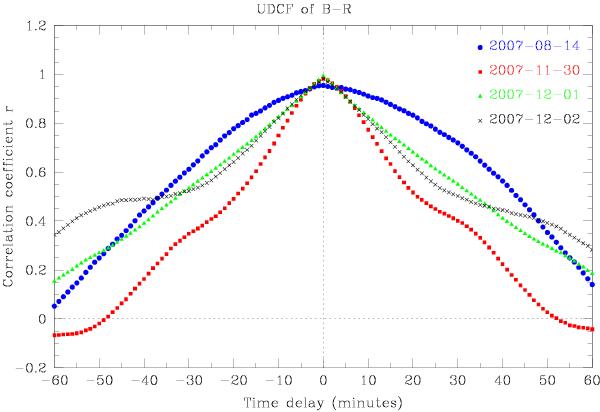
UDCFs between B and R bands light curves on August 14 (blue filled circles), November 30 (red filled squares), December 1 (green filled triangles), and December 2 (black crosses) in 2007. Error bars are omitted for clarity. The UDCFs peak at zero lag, and the corresponding correlation coefficient is r = 0.955 (August 14), 0.982 (November 30), 0.993 (December 1), and 0.981 (December 2), respectively.
Current usage metrics show cumulative count of Article Views (full-text article views including HTML views, PDF and ePub downloads, according to the available data) and Abstracts Views on Vision4Press platform.
Data correspond to usage on the plateform after 2015. The current usage metrics is available 48-96 hours after online publication and is updated daily on week days.
Initial download of the metrics may take a while.