Fig. 12
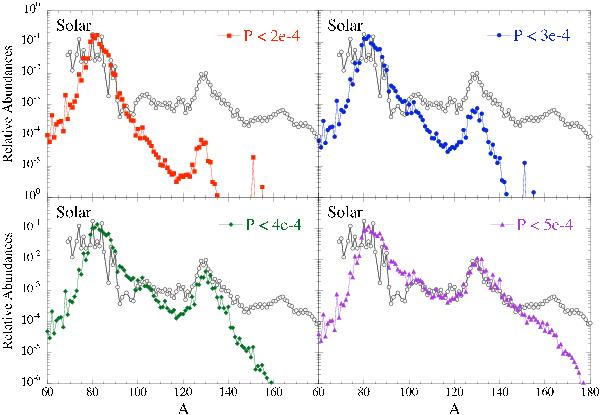
Final abundance distributions for the whole outer crust (as integrated up to a pressure P given in the legend in MeV/fm3) after decompression when initially in NSE at T9 = 8. The calculations are performed with the HFB-19 mass model and corresponding rates. The distributions are compared with the solar r-abundance distributions (dotted circles).
Current usage metrics show cumulative count of Article Views (full-text article views including HTML views, PDF and ePub downloads, according to the available data) and Abstracts Views on Vision4Press platform.
Data correspond to usage on the plateform after 2015. The current usage metrics is available 48-96 hours after online publication and is updated daily on week days.
Initial download of the metrics may take a while.