Fig. 10
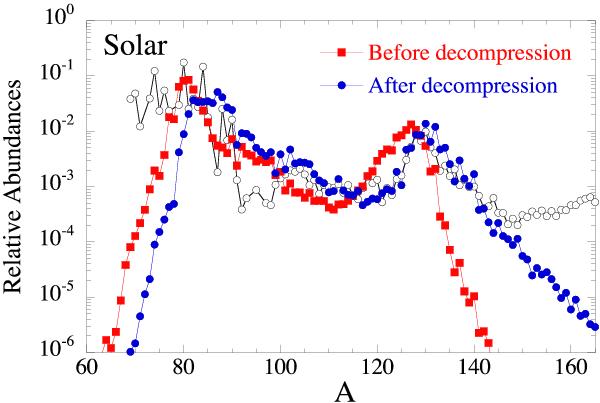
Abundance distribution before and after decompression of a layer with initial pressure P0 = 4 × 10⁻⁴ MeV/fm3 and density ρ0 = 3.4 × 10¹¹ g/cm3 and initially in NSE at T9 = 8. The calculation was performed with the HFB-19 masses and corresponding reaction rates.
Current usage metrics show cumulative count of Article Views (full-text article views including HTML views, PDF and ePub downloads, according to the available data) and Abstracts Views on Vision4Press platform.
Data correspond to usage on the plateform after 2015. The current usage metrics is available 48-96 hours after online publication and is updated daily on week days.
Initial download of the metrics may take a while.