| Issue |
A&A
Volume 531, July 2011
|
|
|---|---|---|
| Article Number | A39 | |
| Number of page(s) | 9 | |
| Section | Extragalactic astronomy | |
| DOI | https://doi.org/10.1051/0004-6361/201116814 | |
| Published online | 07 June 2011 | |
On the nature of the extremely fast optical rebrightening of the afterglow of GRB 081029⋆
1
Università degli studi di Milano-Bicocca,
Piazza della Scienza 3,
20126
Milano,
Italy
e-mail: This email address is being protected from spambots. You need JavaScript enabled to view it.
2
Max-Planck-Institut für extraterrestrische Physik,
Giessenbachstrasse,
85748
Garching,
Germany
3
Thüringer Landessternwarte Tautenburg, Sternwarte 5,
07778
Tautenburg,
Germany
4
American River College, Physics and Astronomy Dpt., 4700 College
Oak Drive, Sacramento, CA
95841,
USA
5
Department of Physics and Astronomy, Clemson
University, Clemson,
SC
29634-0978,
USA
6
Institute of Astronomy, University of Cambridge,
Madingley Road, CB3
0 HA Cambridge,
UK
Received:
2
March
2011
Accepted:
22
April
2011
Abstract
Context. After the launch of the Swift satellite, the gamma-ray burst (GRB) optical light-curve smoothness paradigm has been questioned thanks to the faster and better sampled optical follow-up, which has unveiled a very complex behaviour. This complexity is triggering the interest of the whole GRB community. The GROND multi-channel imager is used to study optical and near-infrared (NIR) afterglows of GRBs with unprecedented optical and near-infrared temporal and spectral resolution. The GRB 081029 has a very prominent optical rebrightening event and is an outstanding example of the application of the multi-channel imager to GRB afterglows.
Aims. Here we exploit the rich GROND multi-colour follow-up of GRB 081029 combined with XRT observations to study the nature of late-time rebrightenings that appear in the optical-NIR light-curves of some GRB afterglows.
Methods. We analyse the optical and NIR observations obtained with the seven-channel Gamma-Ray burst Optical and Near-infrared Detector (GROND) at the 2.2 m MPI/ESO telescope and the X-ray data obtained with the XRT telescope on board the Swift observatory. The multi-wavelength temporal and spectral evolution is discussed in the framework of different physical models.
Results. The extremely steep optical and NIR rebrightening observed in GRB 081029 cannot be explained in the framework of the standard forward shock afterglow model. The absence of a contemporaneous X-ray rebrightening and the evidence of a strong spectral evolution in the optical-NIR bands during the rise suggest two separate components that dominate in the early and late-time light-curves, respectively. The steepness of the optical rise cannot be explained even in the framework of the alternative scenarios proposed in the literature unless a late-time activity of the central engine is assumed.
Key words: techniques: photometric / gamma-ray burst: individual: GRB 081029
Full GROND photometry of GRB 081029 is only available in electronic form at the CDS via anonymous ftp to cdsarc.u-strasbg.fr (130.79.128.5) or via http://cdsarc.u-strasbg.fr/viz-bin/qcat?J/A+A/531/A39
© ESO, 2011
1. Introduction
For years after the discovery of the first gamma-ray burst (GRB) afterglow (van Paradijs et al. 1997), the smoothness of the optical afterglow light-curves has been considered one of the main GRB features (Laursen & Stanek 2003). Nowadays, thanks to the rapid follow up with robotic telescopes, it is possible to reconsider this paradigm and several examples of complex optical light-curves are known. The Gamma-Ray burst Optical Near-infrared Detector (GROND) is a seven-band simultaneous optical-NIR imager mounted on the 2.2 m MPI/ESO telescope at La Silla observatory (Greiner et al. 2008). GROND is a unique instrument to study the optical spectral evolution associated to these complex light-curves (e.g., GRB 071031 Krühler et al. 2009; GRB 080129 Greiner et al. 2009). In this paper, we report on the multi-wavelength observation of GRB 081029. This GRB is characterised by a very complex light-curve with a strong chromatic temporal evolution. In the optical and near-infrared bands an extremely steep rebrightening, at around 3 ks after the trigger, suddenly interrupts the smooth early-time temporal evolution. Thanks to GROND we were able to observe this event simultaneously form the optical g′r′i′z′ to the near-infrared JHKs bands. This unprecedented temporal and spectral resolution allows a time-resolved analysis of the colour evolution. The analysis of the XRT light-curve excludes the presence of a similar rebrightening in the X-ray bands, which casts doubts on the common nature of the optical and X-ray afterglow emission.
The existence of late-time rebrightenings in some GRB optical afterglows has been known since the dawn of afterglow observations (e.g., the optical bump of GRB 970508, Vietri 1998; Sokolov et al. 1998; Nardini et al. 2006) and several models have been proposed to account for deviations from a smooth power-law evolution in the optical light-curves (see Sect. 5). Some of them, in the framework of standard external-shock afterglow model, invoke a discontinuity in the external medium density profile (e.g., Dai & Wu 2003; Lazzati et al. 2002; Nakar & Piran 2003) some of them considering possible variations of the micro-physical parameters into the fireball (Kong et al. 2010). In other cases a possible energy injection into the fireball (e.g., Jóhannesson et al. 2006; Fan & Piran 2006) or complex jet geometry is considered (e.g., Racusin et al. 2009). In the late prompt model (Ghisellini et al. 2007, 2009; Nardini et al. 2010), a late-time activity of the central engine produces optical and X-ray radiation that is superposed on the standard external-shock afterglow emission.
In Sect. 2 we present the available broad-band data set. In Sects. 3 and 4 we describe the complex optical and X-ray light-curves and we analyse the broad-band spectal evolution. In Sect. 5 we study the possible origin of the optical rebrightening, discussing the observed temporal and spectral properties of the afterglow of GRB 081029 in the framework of different physical models.
2. Observations and data reduction
2.1. Swift observations
On 2008 October 29 at 01:43:56 UT, the Swift Burst Alert Telescope (BAT) triggered on a
long burst (trigger = 332931) (Sakamoto et al. 2008) located at coordinates
RA(J2000) = 23h07m06s,
 (Cummings et al. 2008). The BAT mask-weighted
light-curve is characterised by a single smooth peak starting around 50 s before trigger,
peaking around 60 s after the trigger, and ending around 300 s after trigger. The
15–350 keV duration is T90 = 270 ± 45 s. A simple power-law
model provides a good fit of the time-integrated 15–350 keV spectrum with an index
α = 1.43 ± 0.18
(χ2 = 50.7 / 57 d.o.f.). In the same BAT
energy range GRB 081029 has a fluence of
2.1 ± 0.2 × 10⁻⁶ erg cm-2, and a peak flux of
0.5 ± 0.2 × 10⁻⁶ erg cm-2 s-1 (Cummings et al.
2008).
(Cummings et al. 2008). The BAT mask-weighted
light-curve is characterised by a single smooth peak starting around 50 s before trigger,
peaking around 60 s after the trigger, and ending around 300 s after trigger. The
15–350 keV duration is T90 = 270 ± 45 s. A simple power-law
model provides a good fit of the time-integrated 15–350 keV spectrum with an index
α = 1.43 ± 0.18
(χ2 = 50.7 / 57 d.o.f.). In the same BAT
energy range GRB 081029 has a fluence of
2.1 ± 0.2 × 10⁻⁶ erg cm-2, and a peak flux of
0.5 ± 0.2 × 10⁻⁶ erg cm-2 s-1 (Cummings et al.
2008).
Owing to observing constraints, the spacecraft could not immediately slew to the position
of the burst. The X-ray (XRT; Burrows et al. 2005) and UV/Optical Telescope (UVOT; Roming
et al. 2005) did not start to observe the field of GRB 081029 until 2.7 ks after the
trigger. XRT started observing in photon counting (PC) mode and found an uncatalogued
source inside the BAT error box located at
RA(J2000) = 23h07m05.51s,
 (enhanced position obtained combining 2.6 ks of XRT data and 3 UVOT images; Goad et al.
2008).
(enhanced position obtained combining 2.6 ks of XRT data and 3 UVOT images; Goad et al.
2008).
2.2. Optical and NIR observations
The detection of the optical afterglow of GRB 081029 was first reported by Rykoff (2008), who observed an uncatalogued fading source inside the XRT error box with the ROTSE-IIIc telescope. Further observations were reported by Clemens et al. (2008) (GROND), by Covino et al. (2008a) (REM), West et al. (2008) (PROMPT telescopes), and Cobb (2008) (ANDICAM). A redshift of z = 3.8479 ± 0.0002 was first reported by D’Elia et al. (2008) from an observation with VLT/UVES and then confirmed by Cucchiara et al. (2008) with GEMINI/GMOS.
2.2.1. GROND observations and data analysis
GROND started observing the field of GRB 081029 at about 1:52 UT on 2008 October 29 (~8 min after the gamma-ray trigger) and detected the variable source reported by Rykoff (2008) in all seven available optical and NIR bands. GROND kept observing GRB 081029 as long as it was visible from La Silla (until about 7:35 UT). Further multi-band observations were taken one, two, three and five days after the trigger. The GROND optical and NIR image reduction and photometry were performed using standard IRAF tasks (Tody 1993) similar to the procedure described in Krühler et al. (2008b). A general model for the point-spread function (PSF) of each image was constructed using bright field stars, and it was then fitted to the afterglow. Optical photometric calibration was performed relative to the magnitudes of five secondary standards in the GRB field. During photometric conditions, a primary SDSS standard field (Smith et al. 2002) was observed within a few minutes of observing the GRB field in the first night. The obtained zeropoints were corrected for atmospheric extinction and used to calibrate stars in the GRB field. The apparent magnitudes of the afterglow were measured with respect to the secondary standards. The absolute calibration of the JHKs bands was obtained with respect to magnitudes of the Two Micron All Sky Survey (2MASS) stars within the GRB field (Skrutskie et al. 2006).
2.2.2. Host galaxy search
In order to verify the possible presence of a bright (RAB ~ 25 mag) host galaxy associated with the burst, we observed the field of GRB 081029 with the ESO New Technology Telescope (NTT) equipped with EFOSC. Observations started at 02:13:37.74 UTC of 2010 November 3736 days (~6.4 × 10⁷ s) after the burst. Mid-time of the observations is 2010 November 3, 02:46:23 UTC. A series of images in the R-band filter with a total exposure time of 0.8 h was obtained under photometric conditions with a seeing between 0″̣6 and 0″̣8. No source is detected down to a 3σ limiting magnitude of RAB > 25.8 mag, which has been derived by tying the R band magnitudes of field stars to their GROND r′ and i′ photometry1.
2.3. X-ray data reduction and spectral analysis
We analysed the XRT data of GRB 081029 with the Swift software package distributed with HEASOFT (v6.8). The XRT data were reprocessed with the XRTPIPELINE tool2. The entire XRT follow-up of GRB 081029 was performed in PC mode and, since the 0.3–10 keV observed count-rate never exceeded 0.5 counts s-1, no pile-up correction was required (Moretti et al. 2005; Romano et al. 2006; Vaughan et al. 2006). The extraction was in circular regions with typical widths of 25 and 20 pixels depending on the count rate, as discussed in Evans et al. (2009). The spectra were extracted with the standard grade. Background spectra were extracted in regions of the same size far from the source. For all spectra we created ancillary response files (ARF) with the xrtmkarf tool and used the calibration database updated to January 2010. The spectra were re-binned to have a minimum of 20 counts per energy bin, and energy channels below 0.3 keV and above 10 keV were excluded from the analysis. The XSPEC (v12.5.1) software was utilised for the analysis.
We extracted a spectrum of the complete first observation (obsid 00332931000) from about
2.7 ks to about 51 ks for a total XRT exposure time of 21.6 ks. We fitted the spectrum
with a model composed of a power-law with two absorption components at low X-ray energies,
wabs and zwabs. The first one corresponds to Galactic absorption and its column density is
fixed to the Galactic value  (from Kalberla et al. 2005). The second absorption
is due to the material located at the redshift of the source and its column density
(from Kalberla et al. 2005). The second absorption
is due to the material located at the redshift of the source and its column density
 was left free to
vary. The 90% confidence intervals on the best-fit parameters are obtained with the error
command in XSPEC. This spectrum is well fitted by the single power-law model with a
was left free to
vary. The 90% confidence intervals on the best-fit parameters are obtained with the error
command in XSPEC. This spectrum is well fitted by the single power-law model with a
 for
69 d.o.f. The best-fit value of the host galaxy absorption component is
for
69 d.o.f. The best-fit value of the host galaxy absorption component is
 and the spectral index is βX = 0.96 ± 0.09 (where the standard
notation
Fν ∝ ν−β
is used). In order to test for possible spectral evolution, we divided the first
observation into two time intervals. The first one corresponds to the first two orbits
before 11 ks after the trigger and the second covers the rest of the observation. The
best-fit parameters of both spectra are consistent with each other. Results of the X-ray
spectral analysis can be found in Table 1.
and the spectral index is βX = 0.96 ± 0.09 (where the standard
notation
Fν ∝ ν−β
is used). In order to test for possible spectral evolution, we divided the first
observation into two time intervals. The first one corresponds to the first two orbits
before 11 ks after the trigger and the second covers the rest of the observation. The
best-fit parameters of both spectra are consistent with each other. Results of the X-ray
spectral analysis can be found in Table 1.
Results of the X-ray spectral fitting.
3. Afterglow temporal evolution
3.1. Optical and near-infrared light-curve
GRB 081029 is characterised by a complex optical and near-IR light-curve as shown in Fig. 1. We can divide the optical-NIR light-curve into three phases:
-
i)
from 102 to 3.5 × 10³ s: a curved shallow decay phase;
-
from 3.5 × 10³ to 2 × 10⁴ s: a sudden rebrightening of about 1.1 mag in all GROND bands followed by a shallow decay phase superposed with at least three small additional peaks;
-
ii)
from 2 × 10⁴ to 4.4 × 10⁵ s: a steep decay phase.
In the following section we will describe the observed optical-NIR evolution during these three phases.
3.1.1. Phase i)
The seven GROND optical-NIR light-curves of phase i) can be well represented by a
smoothly-connected broken power-law ( ) while a single power-law
fit is excluded (
) while a single power-law
fit is excluded ( ).
If we contemporaneously fit these seven bands using the parametrisation form Beuermann
et al. (1999)
).
If we contemporaneously fit these seven bands using the parametrisation form Beuermann
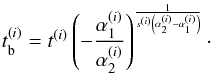
et al. (1999) ![Mathematical equation: \begin{equation} F^{(i)}(t)\propto \left[ \left( \frac{t}{t^{(i)}} \right)^{s^{(i)}\alpha_1^{(i)}}+ \left( \frac{t}{t_{{\rm b}}^{(i)}} \right)^{s^{(i)}\alpha_2^{(i)}} \right]^{-\frac{1}{s^{(i)}}}, \label{broken} \end{equation}](/articles/aa/full_html/2011/07/aa16814-11/aa16814-11-eq51.png) (1)where
(1)where
 (
( ) is
the pre-(post-)break decay index3,
s(i) is the sharpness of the break, the
apex (i) the light-curve phase we are describing and the break time
) is
the pre-(post-)break decay index3,
s(i) is the sharpness of the break, the
apex (i) the light-curve phase we are describing and the break time
 is
defined as,
is
defined as,
 We obtain
 and
and
 , and an achromatic break
located at 940 ± 30 s. The optical magnitudes observed by the REM telescope 2.5 min
after the trigger (Covino et al. 2008a) are consistent with the extrapolation to earlier
times of this curve. A significant deviation from this model can be seen after 2.2 ks,
immediately before the start of the intense rebrightening, where the light-curve
commences a flattening. Unfortunately, we lack observations between 2.7 ks and 3.5 ks,
exactly around the beginning of the rebrightening.
, and an achromatic break
located at 940 ± 30 s. The optical magnitudes observed by the REM telescope 2.5 min
after the trigger (Covino et al. 2008a) are consistent with the extrapolation to earlier
times of this curve. A significant deviation from this model can be seen after 2.2 ks,
immediately before the start of the intense rebrightening, where the light-curve
commences a flattening. Unfortunately, we lack observations between 2.7 ks and 3.5 ks,
exactly around the beginning of the rebrightening.
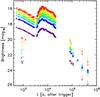 |
Fig. 1 Observed GROND seven-band light-curve of the afterglow of GRB 081029. Fluxes were not corrected for Galactic foreground extinction. The full GROND data set is available as on-line material. |
3.1.2. Phase ii)
A steep rise is observed in all seven GROND bands and starts between 2.5 ks and 3.5 ks.
The lack of observations during this interval does not allow us to precisely test the
achromaticity of this start. Between 3.5 ks and 4.8 ks the light-curve brightens in all
bands by more than 1.1 mag. This rise is very well tracked by the GROND photometry with
twelve 1-min observations in all seven bands. After a short constant flux state lasting
about 400 s, around 5.2 ks after the trigger another rise of about 0.2 mag leads to the
maximum at 5.9 ks (see Fig. 3). In this discussion
we consider this further steep rebrightening at 5.2 ks as the first of a series of
optical flares superposed on the post-break shallower power-law continuum. The
brightness of the afterglow and the consequent small error bars of the optical
photometry during the rise allow the identification of several substructures that make
the light-curve deviate from a simple power-law. Considering only the data after 3000 s,
the steep rise requires a power-law index  and
a break around 4500 s. The position of the break is not well constrained because of the
“flare” at 5.2 ks. If we take into account the possible contribution of the broken
power-law component we used while fitting the phase i) light-curve, the steepness of the
rise is even more extreme.
and
a break around 4500 s. The position of the break is not well constrained because of the
“flare” at 5.2 ks. If we take into account the possible contribution of the broken
power-law component we used while fitting the phase i) light-curve, the steepness of the
rise is even more extreme.
The phase ii) light-curve after the break is characterised by an intense variability (see Fig. 2). Figure 3 shows that it can be reproduced by a curved continuum with at least three flares superposed at t ~ 5.9, 8.1 and 18 ks with a similar flux excess with respect to the continuum (~0.16 mag in the r′ band) and similar logarithmic duration (Δt ~ 0.05 dex). Another two possible less intense events (Δmag ~ 0.07 mag in the r′ band) can also be seen at t ~ 10 ks and t ~ 12 ks. The flares are visible in all seven bands and the peak-times are contemporaneous within errors. The continuum shallow decay underlying the flaring activity can be well described by a temporal index αshallow = 0.47.
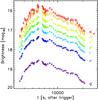 |
Fig. 2 Observed GROND seven-band light-curve of the afterglow of GRB 081029 during phase ii). |
3.1.3. Phase iii)
After a break, the optical-NIR light-curve steepens at around 19 ks. Unfortunately, we lack information about the light-curve decay between 21 ks and 82 ks, owing to the day-time constraint in La Silla. During this unobserved window the light-curve declined by 3 mag, and the GROND observations obtained during the second night (between 82 ks and 108 ks after the trigger) seem to be well connected to the later observations of phase ii) by a unique power-law with a temporal index of about 2.3. Observations in subsequent nights, though, are brighter than the extrapolation of this steep power-law, indicating a flattening of the light-curve after about two days.
The complete light-curve of phases ii) and iii) can be well fitted with a
smoothly-connected triple power-law when excluding from the fit the flaring activity
observed during phase ii) and the late
(t > 2 d) data (see Fig. 3). Any simpler model (i.e., with a smaller number of free parameters
such as e.g., a smoothly-connected double power-law) is excluded
( ).
Using for the smoothly-connected triple power-law a similar functional form as in
Eq. (1), we obtain for phase ii) and
iii)
).
Using for the smoothly-connected triple power-law a similar functional form as in
Eq. (1), we obtain for phase ii) and
iii)  ,
,
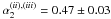 , and
, and
 with a
 .
The late-time (t > 2 d) fluxes are
underestimated by the extrapolation of this model.
.
The late-time (t > 2 d) fluxes are
underestimated by the extrapolation of this model.
 |
Fig. 3 r′ band GROND light-curve of the afterglow of GRB 081029 modelled as a superposition of two separate components as discussed in Sect. 3.1.4. |
3.1.4. The complete GROND light-curve
We finally tried to fit the whole light-curve with an empirical model consisting of the
sum of a smoothly broken power-law such as Eq. (1) and a smoothly-connected double power-law model. The result is similar to
what we reported before, except that the flux contribution from the double power-law
component makes the required temporal index of the rising phase even more extreme
 . For the same reason
the other decay phase indices are slightly steeper than the ones reported above. Using
the same formalism as before, we obtain
. For the same reason
the other decay phase indices are slightly steeper than the ones reported above. Using
the same formalism as before, we obtain  ,
,
 ,
,
 ,
,
 , and
, and
 with a
 (obtained excluding the small sub-flares from the fit). This model is the one reported
in Fig. 3. The slightly higher value of
(obtained excluding the small sub-flares from the fit). This model is the one reported
in Fig. 3. The slightly higher value of
 is mainly
because of the difficulty in reproducing the sharp transition around 3.5 ks and the
possible light-curve flattening after two days. The temporal breaks are consistent
within errors with the separate fits. In this complete light-curve modelling, the
contribution of the broken power-law component is important also at late times
(t > 1 × 10⁵ s), decreasing the
inconsistency of late observations with the triple power-law model. A residual excess
is, however, still present, suggesting either the presence of an underlying dim host
galaxy or a further change in the optical decay index. If the broken power-law component
were affecting the late-time light-curve, a contribution from
r′ = 25 mag host galaxy would account tor the brighter
photometry. When such a component is not contributing at late time, a brighter
r′ = 24.6 mag host is required. As discussed in
Sect. 2.2, we can exclude the presence of an
underlying host galaxy down to a limiting magnitude of
is mainly
because of the difficulty in reproducing the sharp transition around 3.5 ks and the
possible light-curve flattening after two days. The temporal breaks are consistent
within errors with the separate fits. In this complete light-curve modelling, the
contribution of the broken power-law component is important also at late times
(t > 1 × 10⁵ s), decreasing the
inconsistency of late observations with the triple power-law model. A residual excess
is, however, still present, suggesting either the presence of an underlying dim host
galaxy or a further change in the optical decay index. If the broken power-law component
were affecting the late-time light-curve, a contribution from
r′ = 25 mag host galaxy would account tor the brighter
photometry. When such a component is not contributing at late time, a brighter
r′ = 24.6 mag host is required. As discussed in
Sect. 2.2, we can exclude the presence of an
underlying host galaxy down to a limiting magnitude of
 and therefore this flattening is likely related to the afterglow evolution.
3.2. X-ray light-curve
Owing to observing constraints (Sakamoto et al. 2008), XRT started to follow-up GRB 081029 only 2.7 ks after the trigger.
Observations were performed in PC mode and found an X-ray counterpart with a 0.3–10 keV
count rate of about 0.3 cts, corresponding to an unabsorbed flux of about
1.3 × 10⁻¹¹ erg cm-2 s-1 following the spectral
analysis reported in Sect. 2.3. The count rate of the
XRT light-curve was downloaded from the UK Swift Science Data Centre4 (see Evans et al. 2007, 2009, for an extended description of the data
reduction). The X-ray light-curve does not show any evidence of a rebrightening
contemporaneous to the one observed by GROND (see Fig. 4) and can be described by a broken power-law with temporal indices
α1,X = 0.48 ± 0.1 and
α2,X = 2.4 ± 0.17
( ). A
single power-law model is excluded (
). A
single power-law model is excluded ( ). A
small fluctuation (ΔF ~ 0.1 dex) from a straight power-law evolution is
visible during the first orbit (see Sect. 6). These
temporal indices are consistent with the values obtained for the optical-NIR evolution
after the bump (
). A
small fluctuation (ΔF ~ 0.1 dex) from a straight power-law evolution is
visible during the first orbit (see Sect. 6). These
temporal indices are consistent with the values obtained for the optical-NIR evolution
after the bump ( ,
). The
temporal break is located at
,
). The
temporal break is located at  ks,
in perfect agreement with the break of the second component in the GROND light-curve.
ks,
in perfect agreement with the break of the second component in the GROND light-curve.
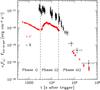 |
Fig. 4 r′ band νFν light-curve (empty circles) superposed on the unabsorbed 0.3–10 keV XRT light-curve (black crosses) of the afterglow of GRB 081029. The r′ band data were corrected for the Galactic foreground extinction. Vertical dashed lines represent the transition time between the different phases described in Sect. 3. |
4. Colour evolution and spectral energy distribution (SED)
Thanks to GROND’s capability of obtaining images in seven bands contemporaneously, it was possible to study the colour evolution during a bright optical rebrightening without requiring any temporal extrapolation. Thanks to the very small errors in the GROND photometry due to the good sky conditions during the first night of observations and thanks to the brightness of the source, we are able to study the evolution of the colour between different bands in every exposure. Comparing the magnitudes observed in different bands we clearly see a sudden reddening during the optical rebrightening (see Fig. 5). A less prominent colour evolution is observed during phase i) with the g′ − z′ colour getting bluer by about Δmag ≈ 0.1 between 400 s and 3000 s. We cannot exclude a further less prominent colour evolution during phase iii) while the hint of colour evolution during the small rebrightenings observed during phase iii) is not statistically significant.
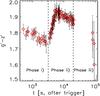 |
Fig. 5 Temporal evolution of the AB magnitudes differences between GROND g′ and z′ bands. Vertical dashed lines represent the transition time between the different phases described in Sect. 3. |
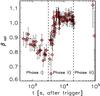 |
Fig. 6 Temporal evolution of the optical spectral index β obtained fitting the unabsorbed Ks,H,J,z′, i′, r′ GROND band SED for all the available observations as discussed in Sect. 4. Vertical dashed lines represent the transition time between the different phases described in Sect. 3. |
In order to estimate the possible effect of the host galaxy dust absorption, we extracted
the optical-NIR SED of GRB 081029 at different times before and after the bump. GRB 081029
occurred at z = 3.8479, therefore both the GROND
g′ (and partially the r′) bands
are affected by the Lyman alpha absorption. Because of the uncertain intergalactic hydrogen
column density along the line of sight, the g′ band is excluded
from the SED fits. We fitted the other six optical-NIR GROND bands (i.e.,
Ks,H,J,z′,i′,r′)
assuming a simple power-law spectrum after correcting the observed fluxes for the foreground
Galactic extinction of
EB − V = 0.03 mag (Schlegel
et al. 1998) corresponding to an extinction of
 mag using
RV = 3.1. Large and Small Magellanic Clouds
(LMC, SMC) and Milky Way (MW) extinction laws from Pei (1992) were used to describe the dust reddening in the host galaxy. We found that
all SEDs are consistent with a negligible host galaxy dust absorption for all considered
extinction curves. Using a SMC extinction curve, we obtained a 90% confidence level upper
limit for the host galaxy extinction
mag using
RV = 3.1. Large and Small Magellanic Clouds
(LMC, SMC) and Milky Way (MW) extinction laws from Pei (1992) were used to describe the dust reddening in the host galaxy. We found that
all SEDs are consistent with a negligible host galaxy dust absorption for all considered
extinction curves. Using a SMC extinction curve, we obtained a 90% confidence level upper
limit for the host galaxy extinction  mag at
10.9 ks. The
Ks,H,J,z′,i′,r′
spectral index (where the standard notation
f(ν) ∝ ν−β
is adopted) is
mag at
10.9 ks. The
Ks,H,J,z′,i′,r′
spectral index (where the standard notation
f(ν) ∝ ν−β
is adopted) is  and the reduced χ2 is 1.06. In Fig. 6 we show the temporal evolution of the optical spectral index for each
individual GROND observation. The colour evolution during the light-curve bump shown in
Fig. 5 is also clearly visible in Fig. 6 where the spectral hardening is also observed before the
bump. This latter early-time colour evolution is consistent with the light-curve break
observed around 900 s to be caused by a spectral break moving bluewards through the observed
GROND bands. The observed Δβopt could be related to an
incomplete passage of a cooling frequency in a wind-like profile if the shape of the cooling
break were very shallow. The slow decay rates observed during phase i) do not agree with the
standard closure relations when compared with the values of βopt
(see, e.g., Racusin et al. 2009) which cast some doubts on this interpretation. The nature
of the optical-NIR afterglow reddening during the rebrightening will be discussed in
Sect. 5.
and the reduced χ2 is 1.06. In Fig. 6 we show the temporal evolution of the optical spectral index for each
individual GROND observation. The colour evolution during the light-curve bump shown in
Fig. 5 is also clearly visible in Fig. 6 where the spectral hardening is also observed before the
bump. This latter early-time colour evolution is consistent with the light-curve break
observed around 900 s to be caused by a spectral break moving bluewards through the observed
GROND bands. The observed Δβopt could be related to an
incomplete passage of a cooling frequency in a wind-like profile if the shape of the cooling
break were very shallow. The slow decay rates observed during phase i) do not agree with the
standard closure relations when compared with the values of βopt
(see, e.g., Racusin et al. 2009) which cast some doubts on this interpretation. The nature
of the optical-NIR afterglow reddening during the rebrightening will be discussed in
Sect. 5.
Because the optical and X-ray light-curves show a similar temporal evolution after the
bump, we can analyse the combined optical to X-rays spectral energy distribution under the
simple assumption that the flux observed in both bands is produced by the same mechanism.
Following the method described in Greiner et al. (2011), we extracted a broad-band SED
around 10 ks. We selected this time interval to obtain a contemporaneous GROND and XRT
coverage and to avoid the presence of the small sub-flares observed during the
rebrightening. We find that the SED is well fit by a single power-law connecting the NIR to
the X-ray band (see Fig. 7). Moreover, no host galaxy
dust absorption is required in this case. The best-fit value for rest-frame reddening is
 mag,
the broad-band spectral index is β = 1.00 ± 0.01 with a host galaxy column
density
mag,
the broad-band spectral index is β = 1.00 ± 0.01 with a host galaxy column
density  ,
which is consistent with both βopt and the values of
βX and from the XRT
spectral analysis reported in Table 1.
,
which is consistent with both βopt and the values of
βX and from the XRT
spectral analysis reported in Table 1.
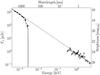 |
Fig. 7 Combined GROND and XRT spectral energy distribution extracted around 11 ks as
discussed in Sect. 4. The dashed line represents
the unabsorbed single power-law connecting the X-rays with the NIR bands and
characterised by a spectral index β = 1.00 ± 0.01. The solid line
represents the same absorbed model with |
5. Nature of the optical rebrightening
The most evident peculiarity of GRB 081029 is the presence of the intense optical rebrightening that occurs around 3.5 ks after the trigger. This is not the first case in which a late-time optical rebrighening is observed in a long GRB afterglow but the intensity of the flux increase and the steepness of the light-curve rise are unusual. Moreover, the density of the available data set and the possibility to contemporaneously study the temporal evolution of the rebrightening in seven bands thanks to GROND make GRB 081029 a unique case.
A sudden increase of optical flux was already observed in one of the first afterglows ever detected. GRB 970508 showed a rebrightening of about 1.5 mag in Ic, R and V bands around one day after the trigger (Sahu et al. 1997; Vietri 1998; Sokolov et al. 1998; Nardini et al. 2006). Other cases reported in the literature are GRB 060206 (Monfardini et al. 2006), GRB 070311 (Guidorzi et al. 2007; Kong et al. 2010), GGRB 71003 (Perley et al. 2008; Ghisellini et al. 2009), and GRB 071010A (Covino et al. 2008b; Kong et al. 2010).
Several interpretations have been proposed for explaining the rebrightenings of these different GRBs but none of them is able to take into account all the characteristics shown by the different light-curves under a unique physical framework. In this section we give a brief overview of the different proposed models and will then check if the broad-band light-curve of GRB 081029 can be explained in the framework of some of these models.
5.1. Discontinuity in the density profile
In the external shock model, a sudden increase of the external medium density can, in principle, produce a rebrightening in the observed afterglow light-curve (Lazzati et al. 2002). Such a density profile can be found in the surroundings of a long GRB. This is caused by the impact of the stellar wind on the interstellar medium (Kong et al. 2010). This effect should be prominent for frequencies between the typical synchrotron frequency and the cooling frequency νm < ν < νc, therefore this could explain the presence of a rebrightening in the optical without a corresponding flux increase in the X-rays if the cooling frequency is located between those bands. The presence of density-jumps was used to explain the fluctuations in the optical light-curves of GRB 030226 (Dai & Wu 2003) and GRB 021004 (Lazzati et al. 2002; Nakar & Piran 2003). However, a change in the external density profile is not expected to produce a colour evolution in the optical-NIR bands if the condition νm < ν < νc persists. Because the cooling frequency is expected to move redwards with increasing density (see, e.g., Panaitescu & Kumar 2000), we would then require the density jump to be high enough to allow νc to move redwards of the observed Ks band to reproduce the observed colour evolution.
However, numerical simulations have shown that even sharp discontinuities with a strong increase in the density profile of a uniform external medium, or the encounter of the blast wave with a wind termination shock, cannot produce a sharp bump in the observed light-curve and only a smooth and diluted change can be detected (Nakar & Granot 2007; van Eerten et al. 2009). For this reason, a simple change in the external medium density is not a reliable explanation because the intense rebrightening of the optical-NIR light-curve of GRB 081029 is very sharp.
5.2. Variation of micro-physics in wind bubbles
In a recent paper, Kong et al. (2010), tried to solve the problem of reproducing sharp light-curve changes for a jump in the density profile. They divide the circum-burst environment into two regions: the first one characterised by a stellar wind density profile, the second one by a shocked stellar wind mixed with a small fraction of the swept-up ISM. Letting the micro-physical parameters ϵe and ϵB vary with the electron energy γ in a different way in the two regions, their synthetic light-curves are able to reproduce the sharp optical rebrightenings observed in some GRBs. In their analysis, Kong et al. (2010) studied only GRBs with contemporaneous bumps in the optical and in the X-rays and took into account only a single optical band without checking for possible colour evolution. For GRB 081029, the X-ray light-curve does not show any contemporaneous rising phase and we also observe a clear colour evolution in the GROND energy range during the bump. A fine-tuning in the assumed evolution of the micro-physical parameters would therefore be required to force νc to pass through the optical-NIR energy range at exactly the same time as the changing of the density profile to observe a similar colour evolution. The analysis of the effects of a variation of ϵe and ϵB on the cooling frequency is required to test if this scenario can also explain cases like GRB 081029. Also in this case, however, the pre-bump evolution observed in the X-rays lacks explanation unless the X-ray frequencies are completely unaffected by these changes.
5.3. Late prompt model
In the late prompt model (Ghisellini et al. 2007, 2009; Nardini et al. 2010), the observed optical, NIR, and X-ray light-curves of GRBs are produced by the sum of two separate components: the standard forward shock afterglow emission and a radiation related to a late-time activity of the central engine sustained by the accretion of the fall-back material that failed to reach the escape velocity of the progenitor star. The combined effect of these two components can reproduce a large variety of observed light-curves (Ghisellini et al. 2009) and is also used to describe the presence of late-time optical rebrightenings in the light-curves of GRB 071003 (Ghisellini et al. 2009) and GRB 061126 (Ghisellini et al. 2009; Nardini et al. 2010). In these events, the excess of optical flux with respect to the extrapolation of the earlier light-curve appears because the standard afterglow emission is decaying as a power-law while the late prompt component is still constant or slightly increasing and therefore it becomes dominant at late times. Because the two components originate in completely different mechanisms, a colour evolution in the optical-NIR SED during the bump is expected, similar to the one obtained for GRB 081029. A colour change related to an increasingly dominant second component is indeed observed both in GRB 071003 and in GRB 061126 (Ghisellini et al. 2009; Nardini et al. 2010). On the other hand, in the late prompt model (Ghisellini et al. 2007), the early-time flat (or slowly increasing) evolution of the late prompt component is caused by a geometrical effect (i.e., increase of the visible emitting surface owing to a decrease of the Γ lorentz factor of the slower “late prompt” shells). For GRB 081029 the rise of the optical rebrightening is extremely steep which renders this scenario unlikely unless a delayed reactivation of the central engine is responsible for the emission of these less energetic shells. This delayed starting point would allow a new definition of the late prompt component starting time and consequently a flattening of this component’s light-curve rise.
5.4. Two-component jet model
Another scenario that invokes the coexistence of two separate emitting processes, and therefore allows the observation of a discontinuity in the light-curve with a contemporaneous colour evolution, is the two-component jet model. The presence of a fast narrow jet, co-alligned with a wider, slower jet has been claimed to be able to describe the complex broad-band evolution of some GRBs (e.g., GRB 030329 Berger et al. 2003, GRB 080319B Racusin et al. 2009; GRB 080413B Filgas et al. 2010). In this scenario, a flattening or a bump in the observed light-curve can be observed when the onset of the afterglow produced by the slower (and wider) jet occurs when the afterglow emission of the faster (and narrower) jet is already decreasing fast because of an early-time jet break. The rising wider jet afterglow can be characterised by a different SED in the observed bands and therefore a colour evolution can be observed during the transition. At later times the observed radiation is dominated by the wider jet afterglow.
The complexity of the GRB 081029 light-curve is hard to explain in the framework of this
scenario. The flat early-time optical light-curve observed before the rebrightening, when
interpreted in the framework of a standard forward shock afterglow scenario, suggests an
environment characterised by a wind-like density profile. On the other hand, to obtain a
steep rebrighening at later times, the second jet afterglow light-curve requires an
ISM-like external medium. Moreover, the optical rise that is required for two separate
components is much steeper than the pre-peak rise previously observed in other GRBs
(Rykoff et al. 2009; Panaitescu & Vestrand
2008). In the standard forward shock emission
scenario for an isotropic outflow seen face-on by the observer, during the
pre-deceleration phase the optical light-curve is supposed to rise as
F ∝ t2 or t3
depending on the location of the cooling frequency. A steeper
F ∝ t4 rise can be obtained for of an
off-axis observer for a collimated outflow with a sharp angular boundary (Panaitescu
& Vestrand 2008). No steeper rise, similar
to the one observed for GRB 081029 can be reproduced under these standard assumptions.
Panaitescu & Vestrand (2008) also found
that the afterglows showing a fast pre-peak rise
(α < −1) are characterised by a correlation
between the k-corrected optical flux at the peak and the
redshift-corrected peak time assuming a common redshift z = 2.
Considering only the contribution of the second component corrected for the Galactic
foreground absorption (i.e., the triple power-law described in Sect. 3), the peak flux calculated in the r-band re-locating GRB 081029 at
z = 2 is  mJy. The peak time at
redshift 2 is
mJy. The peak time at
redshift 2 is  ks. Comparing these values with
the plot shown in Fig. 2 of Panaitescu & Vestrand (2008), the rebrightening of GRB 081029 is inconsistent with this correlation
with GRB 081029 having a peak flux that is much brighter than expected for the peak time.
That confirms the difficulties of explaining the fast optical bump of GRB 081029 as the
signature of a second jet afterglow with the same initial time as the one responsible for
the early-time light-curve.
ks. Comparing these values with
the plot shown in Fig. 2 of Panaitescu & Vestrand (2008), the rebrightening of GRB 081029 is inconsistent with this correlation
with GRB 081029 having a peak flux that is much brighter than expected for the peak time.
That confirms the difficulties of explaining the fast optical bump of GRB 081029 as the
signature of a second jet afterglow with the same initial time as the one responsible for
the early-time light-curve.
5.5. Energy injection
An alternative scenario invoked for explaining late-time optical bumps is a discrete episode of energy injection into the fireball by the late-time interaction of slow shells with the forward shock (Jóhannesson et al. 2006; Fan & Piran 2006; Covino et al. 2008b; Rossi et al. 2011). In GRB 081029, the steepness of the optical bump and the large ratio between the second component and the extrapolation of the early broken power-law decay (between ~5 and 8 during the bump) imply a sudden release of a large amount of energy at late times. Such an energy injection is not supposed to produce a change in the observed synchrotron spectral slopes under the standard assumption of non-evolving micro-physical parameters in the fireball (e.g., ϵe, p, ϵb) Under this assumption, an observed spectral evolution can only be produced if one of the characteristic frequencies (e.g., the cooling frequency νc) crosses the observed bands. On the other hand, we know that no contemporaneous rebrightening is observed in the X-rays. This evidence acts against this scenario because an episode of energy injection would increase the normalisation of the whole synchrotron spectrum, which would be visible at all wavelengths.
6. Discussion
The complex light-curve of GRB 081029 is a remarkable example of how the increasing quality
of optical-NIR follow-up represents a hard test for the proposed afterglow emission models.
In Sect. 5 we have shown how the most commonly invoked
extensions of the standard external shock afterglow models fail to reproduce the steep
optical rise observed in the GRB 081029 light-curve without invoking fine-tuned sets of
parameters that still lack a convincing physical interpretation. The component that is
dominating the early-time pre-bump optical-NIR light-curve is likely still present, although
weak, during the optical bump and becomes dominant again after 105 s. This
evidence, together with the sudden colour evolution that accompanies the optical
rebrightening, favours the two-component nature of this light-curve. As discussed in
Sects. 5.3 and 5.4, both the late prompt an the two-component jet models fail to explain the
extremely steep rise of the second component
(F(t) ∝ t ~ 8) in their standard
formulation. This problem could be solved by re-scaling the time at which the second
component starts to act. If we shift the starting point of the second component
t0,2 from the gamma-ray detector trigger time
to the mean time of the first GROND observation in which we detect the rebrightening (i.e.
t0,2 = 3500 s after trigger), we have the
shallowest value of the rise we can obtain with this simple temporal rescaling. Taking into
account the contribution of the ongoing early-time component, we obtain a rising temporal
index of about  for the
second component. We can therefore obtain any value for
for the
second component. We can therefore obtain any value for
 between
–0.7 and –8.2 selecting a new t0,2 between the
trigger time and 3.5 ks. For example, a slope
between
–0.7 and –8.2 selecting a new t0,2 between the
trigger time and 3.5 ks. For example, a slope  , typical of the
fast optical rise afterglows studied by Panaitescu & Vestrand
(2008), can be obtained by shifting the initial
time to t0,2 ≈ 2500 s after trigger. Using this
new observer frame t0,2 ≈ 2500 s, the peak-time
at redshift 2 is
, typical of the
fast optical rise afterglows studied by Panaitescu & Vestrand
(2008), can be obtained by shifting the initial
time to t0,2 ≈ 2500 s after trigger. Using this
new observer frame t0,2 ≈ 2500 s, the peak-time
at redshift 2 is  ks. This value decreases the
inconsistency with the correlation found by Panaitescu & Vestrand (2008), but the peak of the second component of GRB 081029
still lies above the correlation reported in that paper.
ks. This value decreases the
inconsistency with the correlation found by Panaitescu & Vestrand (2008), but the peak of the second component of GRB 081029
still lies above the correlation reported in that paper.
Rescaling the t0,2 requires a reactivation of the central engine ~0.5 ks (2.5 ks in the observer-frame) after the main event. Such a rescaling of t0,2 implies that a new process separated from the one producing the early optical light-curve is activated several hundred seconds after the main event. If this process is related to a delayed reactivation of the central engine, this could produce an observable signature at higher frequencies around the new t0,2. The existence of prompt GRB light-curves showing long periods of quiescence between separate peaks lasting up to a few hundreds seconds has already been discussed in the literature (Ramirez-Ruiz et al. 2001; Romano et al. 2006; Burlon et al. 2008, 2009; Gruber et al. 2010). Most of them are pre-cursors (i.e., peaks preceding the main GRB event), but Burlon et al. (2008) report on the case of GRB 060210 where two post-cursors are observed 60 and 150 s after the end of the main burst. There is no clear example with later time (t ≥ 1500 s) post-cursors, although faint late-time peaks are hardly detectable by BAT (see Holland et al. 2010, for a possible candidate). This late-time activity of the central engine could likely be detectable in the X-rays as a peak/flare in the XRT light-curve around the new value of t0,2. Unfortunately, Swift slewed to GRB 081029 only after 2700 s owing to an observing constraint (Sakamoto et al. 2008), and therefore we cannot constrain the presence of such a signature around 2000–2500 s. However, the Swift slew was early enough to observe the X-ray afterglow for around 1 ks before the start of the optical rise. This early XRT light-curve remains more or less constant during the first XRT orbit (between 2.7 and 5.5 ks) apart from a small fluctuation of the same order as the flux error bars. No steep rise is therefore shown by the X-ray light-curve simultaneous to the optical one. Because the X-ray light-curve tracks the GROND one after the optical rise and the broad-band SED is consistent with a single power-law (see Sect. 4), we can assume that they are produced by the same mechanism. Under this assumption the lack of a contemporaneous X-ray rebrightening around 4 ks is barely understandable without invoking an additional flux contribution in the X-rays in the first 1 ks of the XRT observation. The quality of the X-ray light-curve before 3.5 ks is not sufficient to test whether the XRT light-curve before 4 ks is intrinsically constant or if it is caused by a superposition of a component rising at a later time (similar to the one observed in the GROND bands) with the decreasing tail of an unobserved flare that is occurred before 2.7 ks. Even if it not possible to constrain a possible X-ray spectral change during these early observations with a spectral fitting, the hardness-ratio light-curve obtained using the publicly available Swift Burst Analiser5 (Evans et al. 2010) shows a statistically significant evolution during the first orbit (between 2.7 ks and 5.1 ks). This agrees with the presence of an undetected X-ray flare at earlier times, corresponding with the possible reactivation of the central engine responsible of the optical and X-ray emission after 4 ks.
7. Conclusions
In conclusion, the most commonly invoked extensions of the standard afterglow models fail to explain the steepness of the optical rebrightening observed in GRB 081029 in particular when combined with the associated colour evolution and with the lack of a contemporaneous rise in the X-rays. That the post-rise optical-NIR light-curve tracks the X-ray evolution well suggests the existence of a second component, separated from the one producing the early-time optical afterglow, responsible for both the observed optical and X-rays flux at later times. We are unable to determine the nature of this second component, but from the combined GROND and XRT light-curve we can infer the following phenomenological argument. An easy way to explain the steepness of the rise of this second component is to assume a reactivation of the central engine around 0.5 ks after the prompt emission onset. Unfortunately, the lack of XRT coverage before 2.7 ks (obs frame) does not allow a direct proof of this hypothesis (e.g., detecting a flare/post-cursor in the X-rays). However, the flux excess in the first 1 ks of the XRT light-curve with respect to the optical-NIR one is consistent with the existence of an undetected X-ray post-cursor at the initial time of the second component.
Part of the XRT software, distributed with the HEASOFT package: http://heasarc.gsfc.nasa.gov/heasoft/
Note that in this equation we use the standard notation in which positive (negative) values of α imply a decline (rise) of the light-curve.
Acknowledgments
We would like to thank the anonymous referee for her/his useful comments. M.N. acknowledges support by DFG grant SA 2001/2-1. T.K. acknowledges support by the DFG cluster of excellence “Origin and Structure of the Universe”, and A.N.G., D.A.K., A. Rossi, and A.U. are grateful for travel funding support through MPE. F.O.E. acknowledges funding of his Ph.D. through the Deutscher Akademischer Austausch-Dienst (DAAD), S.K. and A. Rossi acknowledge support by DFG grant Kl 766/13-2 and A. Rossi additionally from the BLANCEFLOR Boncompagni-Ludovisi, née Bildt foundation. Part of the funding for GROND (both hardware as well as personnel) was generously granted from the Leibniz-Prize to Prof. G. Hasinger (DFG grant HA 1850/28-1). D.B. is supported through DLR 50 OR 0405. S.K., A.N.G. and D.A.K. acknowledge support by DFG grant Kl 766/16-1. This work made use of data supplied by the UK Swift Science Data Centre at the University of Leicester.
References
- Berger, E., Kulkarni, S. R., Pooley, G., et al. 2003, Nature, 426, 154 [NASA ADS] [CrossRef] [PubMed] [Google Scholar]
- Beuermann, K., Hessman, F. V., Reinsch, K., et al. 1999, A&A, 352, L26 [NASA ADS] [Google Scholar]
- Burlon, D., Ghirlanda, G., Ghisellini, G., et al. 2008, ApJ, 685, L19 [NASA ADS] [CrossRef] [Google Scholar]
- Burlon, D., Ghirlanda, G., Ghisellini, G., Greiner, J., & Celotti, A. 2009, A&A, 505, 569 [NASA ADS] [CrossRef] [EDP Sciences] [Google Scholar]
- Clemens, C., Loew, S., & Greiner, J. 2008, GCN, 8437 [Google Scholar]
- Cobb, B. E. 2008, GCN, 8452 [Google Scholar]
- Covino, S., Antonelli, L. A., Malesani, D., et al. 2008a, GCN, 8441 [Google Scholar]
- Covino, S., D’Avanzo, P., Klotz, A., et al. 2008b, MNRAS, 388, 347 [NASA ADS] [CrossRef] [Google Scholar]
- Cucchiara, A., Fox, D. B., Cenko, S. B., & Berger, E. 2008, GCN, 8448 [Google Scholar]
- Cummings, J. R., Barthelmy, S. D., Baumgartner, W. H., et al. 2008, GCN, 8447 [Google Scholar]
- Dai, Z. G., & Wu, X. F. 2003, ApJ, 591, L21 [NASA ADS] [CrossRef] [Google Scholar]
- D’Elia, V., Covino, S., & D’avanzo, P. 2008, GCN, 8438 [Google Scholar]
- Evans, P. A., Beardmore, A. P. M., Page, K. L., et al. 2007, A&A, 469, 379 [NASA ADS] [CrossRef] [EDP Sciences] [Google Scholar]
- Evans, P. A., Osborne J. P., Burrows D. N., & Barthelmy, S. D. 2008, GCN, 7955 [Google Scholar]
- Evans, P. A., Beardmore, A. P., Page, K. L., et al. 2009, MNRAS, 397, 1177 [NASA ADS] [CrossRef] [Google Scholar]
- Evans, P. A., Willingale, R., Osborne, J. P., et al. 2010, A&A, 519, A102 [NASA ADS] [CrossRef] [EDP Sciences] [Google Scholar]
- Fan, Y., & Piran, T. 2006, MNRAS, 369, 197 [NASA ADS] [CrossRef] [Google Scholar]
- Filgas, R., Kruhler, T., Greiner, J., et al. 2011, A&A, 526, A113 [NASA ADS] [CrossRef] [EDP Sciences] [Google Scholar]
- Ghisellini, G., Ghirlanda, G., Nava, L., & Firmani, C. 2007, ApJ, 658, L75 [NASA ADS] [CrossRef] [Google Scholar]
- Ghisellini, G., Nardini, M., Ghirlanda, G., & Celotti, A. 2009, MNRAS, 393, 253 [NASA ADS] [CrossRef] [Google Scholar]
- Guidorzi, C., Vergani, S. D., Sazonov, S., et al. 2007, A&A, 474, 793 [NASA ADS] [CrossRef] [EDP Sciences] [Google Scholar]
- Goad, M. R., Osborne, J. P., Beardmore, A. P., & Evans, P. A. 2008, GCN, 8443 [Google Scholar]
- Greiner, J., Bornemann, W., Clemens, C., et al. 2008, PASP, 120, 405 [NASA ADS] [CrossRef] [Google Scholar]
- Greiner, J., Kruhler, T., McBreen, S., et al. 2009, ApJ, 693, 1912 [NASA ADS] [CrossRef] [Google Scholar]
- Greiner, J., Kruhler, T., Klose, S., et al. 2011, A&A, 526, A30 [NASA ADS] [CrossRef] [EDP Sciences] [Google Scholar]
- Jóhannesson, G., Björnsson, G., & Gudmundsson, E. H. 2006, ApJ, 647, 1238 [NASA ADS] [CrossRef] [Google Scholar]
- Holland, S., Björnsson, G., Hjorth, J., & Thomsen, B. 2000, A&A, 364, 467 [NASA ADS] [Google Scholar]
- Holland, S., Sbarufatti, B., Shen, R., et al. 2010, ApJ, 717, 223 [NASA ADS] [CrossRef] [Google Scholar]
- Kalberla, P. M. W., Burton, W. B., Hartmann, D., et al. 2005, A&A, 440, 775 [NASA ADS] [CrossRef] [EDP Sciences] [Google Scholar]
- Kong, S. W., Wong, A. Y. L., Huang, Y. F., & Cheng, K. S. 2010, MNRAS, 402, 409 [NASA ADS] [CrossRef] [Google Scholar]
- Krühler, T., Küpcü, Y., Greiner, J., et al. 2008, ApJ, 685, 376 [NASA ADS] [CrossRef] [Google Scholar]
- Krühler, T., Greiner, J., McBreen, S., et al. 2009, ApJ, 697, 758 [NASA ADS] [CrossRef] [Google Scholar]
- Laursen, L. T., & Stanek, K. Z. 2003, ApJ, 597, L107 [Google Scholar]
- Lazzti, D., Rossi, E., Covino, S., Ghisellini, G., & Malesani, D. 2002, A&A, 296, L5 [NASA ADS] [CrossRef] [EDP Sciences] [Google Scholar]
- Monfardini, A., Kobayashi, S., Guidorzi, C., et al. 2006, ApJ, 648, 1125 [NASA ADS] [CrossRef] [Google Scholar]
- Moretti, A., Campana, S., Mineo, T., et al. 2005, SPIE, 5898, 360 [Google Scholar]
- Nakar, E., & Granot, J. 2007, MNRAS, 380, 1744 [NASA ADS] [CrossRef] [Google Scholar]
- Nakar, E., & Piran, T. 2003, ApJ, 598, 400 [NASA ADS] [CrossRef] [Google Scholar]
- Nardini, M., Ghisellini, G., Ghirlanda, G., et al. 2006, A&A, 451, 821 [NASA ADS] [CrossRef] [EDP Sciences] [Google Scholar]
- Nardini, M., Ghisellini, G., Ghirlanda, G., & Celotti, A. 2010, MNRAS, 403, 1131 [NASA ADS] [CrossRef] [Google Scholar]
- Panaitescu, A., & Kumar, P. 2000, ApJ, 543, 76 [NASA ADS] [Google Scholar]
- Panaitescu, A., & Vestrand, W. T. 2008, 387, 497 [Google Scholar]
- Perley, D. A., Li, W., Chornock, R., et al. 2008, ApJ, 688, 470 [NASA ADS] [CrossRef] [Google Scholar]
- Pei, Y. C. 1992, ApJ, 395, 130 [NASA ADS] [CrossRef] [Google Scholar]
- Rossi, A., Schulze, S., Kose, S., et al. 2011, A&A, 529, A142 [NASA ADS] [CrossRef] [EDP Sciences] [Google Scholar]
- Racusin, J. L., Karpov, S. V., Sokolowski, M., et al. 2008, Nature, 455, 183 [Google Scholar]
- Ramirez-Ruiz, E., Merloni, A., & Rees, M. J. 2001, MNRAS, 324, 1147 [NASA ADS] [CrossRef] [Google Scholar]
- Romano, P., Campana, S., Chincarini, G., et al. 2006, A&A, 456, 917 [NASA ADS] [CrossRef] [EDP Sciences] [Google Scholar]
- Rykoff, E. S. 2008, GCN, 8436 [Google Scholar]
- Rykoff, E. S., Aharonian, F., Akerlof, C. W., et al. 2009, ApJ, 702, 489 [NASA ADS] [CrossRef] [Google Scholar]
- Sahu, K. C., Livio, M., Petro, L., et al. 1997, ApJ, 498, 127 [Google Scholar]
- Sakamoto, T., Baumgartner, W. H., Burrows, D. N., et al. 2008, GCN, 8435 [Google Scholar]
- Schlegel, D. J., Finkbeiner, D. P., & Davis, M. 1998, ApJ, 500, 525 [NASA ADS] [CrossRef] [Google Scholar]
- Skrutskie, M. F., Cutri, R. M., Stiening, R., et al. 2006, AJ, 131, 1163 [NASA ADS] [CrossRef] [Google Scholar]
- Smith, J. A., Tucker, D. L., Kent, S., et al. 2002, AJ, 123, 2121 [Google Scholar]
- Sokolov, V. V., Kopylov, A. I., Zharikov, S. V., et al. 1998, A&A, 334, 117 [NASA ADS] [Google Scholar]
- Tody, D. 1993, Astronomical Data Analysis Software and Systems II, 52, 173 [NASA ADS] [Google Scholar]
- van Eerten, H. J., Meliani, Z., Wijers, R. A. M. J., & Keppens, R. 2009, MNRAS, 398, L63 [NASA ADS] [CrossRef] [Google Scholar]
- van Paradijs, J., Groot, P. J., Galama, T., et al. 1997, Nature, 386, 686 [NASA ADS] [CrossRef] [Google Scholar]
- Vaughan, S., Goad, M. R., Beardmore, A. P., et al. 2006, ApJ, 638, 920 [NASA ADS] [CrossRef] [Google Scholar]
- Vietri, M. 1997, ApJ, 488, L105 [NASA ADS] [CrossRef] [Google Scholar]
- West, J. P., Haislip, J., Reichart, D., et al. 2008, GCN, 8449 [Google Scholar]
All Tables
All Figures
|
Fig. 1 Observed GROND seven-band light-curve of the afterglow of GRB 081029. Fluxes were not corrected for Galactic foreground extinction. The full GROND data set is available as on-line material. |
| In the text | |
|
Fig. 2 Observed GROND seven-band light-curve of the afterglow of GRB 081029 during phase ii). |
| In the text | |
|
Fig. 3 r′ band GROND light-curve of the afterglow of GRB 081029 modelled as a superposition of two separate components as discussed in Sect. 3.1.4. |
| In the text | |
|
Fig. 4 r′ band νFν light-curve (empty circles) superposed on the unabsorbed 0.3–10 keV XRT light-curve (black crosses) of the afterglow of GRB 081029. The r′ band data were corrected for the Galactic foreground extinction. Vertical dashed lines represent the transition time between the different phases described in Sect. 3. |
| In the text | |
|
Fig. 5 Temporal evolution of the AB magnitudes differences between GROND g′ and z′ bands. Vertical dashed lines represent the transition time between the different phases described in Sect. 3. |
| In the text | |
|
Fig. 6 Temporal evolution of the optical spectral index β obtained fitting the unabsorbed Ks,H,J,z′, i′, r′ GROND band SED for all the available observations as discussed in Sect. 4. Vertical dashed lines represent the transition time between the different phases described in Sect. 3. |
| In the text | |
|
Fig. 7 Combined GROND and XRT spectral energy distribution extracted around 11 ks as
discussed in Sect. 4. The dashed line represents
the unabsorbed single power-law connecting the X-rays with the NIR bands and
characterised by a spectral index β = 1.00 ± 0.01. The solid line
represents the same absorbed model with |
| In the text | |
Current usage metrics show cumulative count of Article Views (full-text article views including HTML views, PDF and ePub downloads, according to the available data) and Abstracts Views on Vision4Press platform.
Data correspond to usage on the plateform after 2015. The current usage metrics is available 48-96 hours after online publication and is updated daily on week days.
Initial download of the metrics may take a while.