Fig. 7
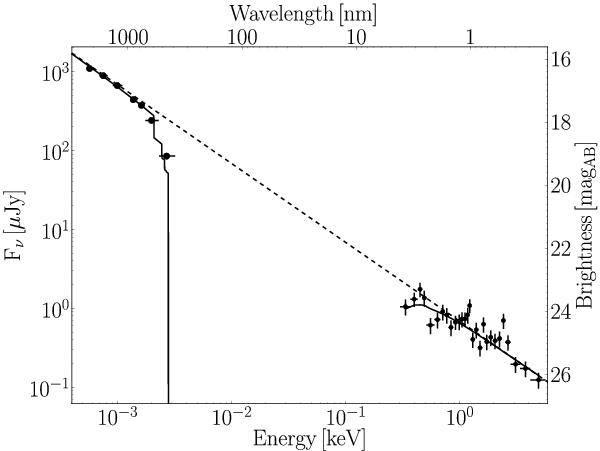
Combined GROND and XRT spectral energy distribution extracted around 11 ks as
discussed in Sect. 4. The dashed line represents
the unabsorbed single power-law connecting the X-rays with the NIR bands and
characterised by a spectral index β = 1.00 ± 0.01. The solid line
represents the same absorbed model with  mag and
 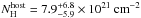 .
Note that the g′ (and partially the
r′) bands are strongly affected by the Lyman break at
z = 3.8.
.
Note that the g′ (and partially the
r′) bands are strongly affected by the Lyman break at
z = 3.8.
Current usage metrics show cumulative count of Article Views (full-text article views including HTML views, PDF and ePub downloads, according to the available data) and Abstracts Views on Vision4Press platform.
Data correspond to usage on the plateform after 2015. The current usage metrics is available 48-96 hours after online publication and is updated daily on week days.
Initial download of the metrics may take a while.