| Issue |
A&A
Volume 531, July 2011
|
|
|---|---|---|
| Article Number | A22 | |
| Number of page(s) | 10 | |
| Section | Extragalactic astronomy | |
| DOI | https://doi.org/10.1051/0004-6361/201116756 | |
| Published online | 01 June 2011 | |
Nova M31N 2007-12b: supersoft X-rays reveal an intermediate polar?⋆
1
Max-Planck-Institut für extraterrestrische Physik, Giessenbachstraße, 85741 Garching, Germany
e-mail: This email address is being protected from spambots. You need JavaScript enabled to view it.
2
Institut de Ciències de l’Espai (CSIC-IEEC), Campus UAB, Fac. Ciències, 08193 Bellatera, Spain
3
Departament de Física i Enginyeria Nuclear, EUETIB (UPC-IEEC), Comte d‘Urgell 187, 08036 Barcelona, Spain
4
Department of Physics and Astronomy, Clemson University, Clemson, SC 29634-0978, USA
5
European Southern Observatory (ESO), 85748 Garching, Germany
6
INAF - Napoli, Osservatorio Astronomico di Capodimonte, Salita Moiariello 16, 80131 Napoli, Italy
7
International Centre for Relativistic Astrophysics, Piazzale della Repubblica 2, 65122 Pescara, Italy
Received: 21 February 2011
Accepted: 14 April 2011
Abstract
Context. In the central part of M 31, a high number of optical novae can be targeted within the field of view of the XMM-Newton EPIC and Chandra HRC-I X-ray detectors. A special monitoring program of the area has allowed us to investigate supersoft emission of individual novae in detail and perform a statistical analysis of the sample.
Aims. For the He/N nova M31N 2007-12b, we aimed to constrain the time of appearance of a supersoft source (SSS) and the duration of the SSS state as well as determine the spectral and time variability while the source was bright.
Methods. We analyzed XMM-Newton EPIC and Chandra HRC-I observations of our monitoring program performed at intervals of ten days and added results of a XMM-Newton target of opportunity observation and Swift XRT observations. We performed source detection, determined long-term time and spectral variation of M31N 2007-12b, and searched for shorter-term time variability in the individual observations when the source was bright, using fast Fourier and folding techniques to analyze periodicities.
Results. The SSS emission started between 21 and 30 d after the optical outburst and ended between 60 and 120 d after outburst, making M31N 2007-12b one of the few novae with the shortest SSS phase known. The X-ray spectrum was supersoft and can be fitted with a white dwarf (WD) atmosphere model with solar abundances absorbed by the Galactic foreground. The temperature of the WD atmosphere seems to increase at the beginning of the SSS phase from ~70 to ~80 eV. The luminosity of M31N 2007-12b during maximum was at the Eddington limit of a massive WD and dropped by ~30% in the observation 60 d after outburst. The radius of the emission region is ~6 × 108 cm. In the four bright state observations, we detected a stable 1110 s pulsation, which we interpret as the WD rotation period. In addition, we detect dips in three observations that might represent a 4.9 h or 9.8 h binary period of the system.
Conclusions. Nova envelope models with ≲ 50% mixing between solar-like accreted material and the degenerate core of the WD can be used to describe the data. We derive a WD mass of 1.2 M⊙, as well as an ejected and burned mass of 2.0 × 10⁻⁶ M⊙ and 0.2 × 10⁻⁶ M⊙, respectively. The observed periodicities indicate that nova M31N 2007-12b erupted in an intermediate polar (IP) system. The WD photospheric radius seems to be larger than expected for a non-magnetic WD but in the range for magnetic WDs in an IP system.
Key words: galaxies: individual: M 31 / novae, cataclysmic variables / stars: individual: nova M31N 2007-12b / X-rays: galaxies / X-rays: binaries
Based on observations obtained with XMM-Newton, an ESA Science Mission with instruments and contributions directly funded by ESA Member States and NASA.
© ESO, 2011
1. Introduction
Outbursts of classical novae (CNe) are caused by a thermonuclear runaway on the surface of a white dwarf (WD) in a cataclysmic variable (CV), i.e. a close binary system with transfer of material from the companion star to the WD (see e.g. Jośe & Hernanz 1998; Yaron et al. 2005; Starrfield et al. 2008). Ignition takes place in the accreted envelope and as a consequence, the envelope expands and causes the brightness of the star to increase. While a fraction of the envelope is ejected, part of it remains in steady nuclear burning on the WD surface. This area radiates as a supersoft X-ray source (SSS), which can be identified with the spectrum of a hot (Teff:105 − 106 K) WD atmosphere as soon as the soft X-rays can penetrate the ejected envelope (MacDonald & Vennes 1991). The duration of the SSS phase is shorter for more massive WDs. It also depends on the metallicity of the envelope. The time of appearance of the SSS is determined by the mass ejected in the outburst and the ejection velocity (for model calculations see e.g. Hachisu & Kato 2006).
Models (see e.g. Hachisu & Kato 2006, 2010) have been developed to explain these smooth SSS light curves. However, specifically at the start of the SSS phase several Galactic novae have shown strong – possibly periodic – time variability (see e.g. Hachisu et al. 2007; Ness et al. 2009; Bode et al. 2009b). Pulsations of the SSS emission may indicate the WD rotation period (see e.g. Dobrotka & Ness 2010). However, until now it has mainly been inferred from optical data that several novae exploded in intermediate polar (IP) systems (Warner 2002). IPs (often also called DQ Herculis stars after the prototype of the class) are cataclysmic variables containing an accreting, magnetic, rapidly rotating WD. In contrast to the polar (AM Herculis) systems, the orbital and rotation period of the WD are not synchronized. The regular pulsations in IPs seen in optical and X-rays are explained by magnetically channeled accretion onto the poles of the WD within a truncated disk (for a review, see Patterson 1994).
Recurrent novae (RNe) are CNe that have more than one recorded outburst. RNe are specifically interesting as they have been discussed as one of the most likely progenitors of type Ia supernovae (see e.g. reviews by Anupama 2008; Kotak 2008).
The optical outburst of nova M31N 2007-12b was detected independently by several groups (see entries on the Central Bureau for Astronomical Telegrams CBAT M31 (Apparent) Novae Page1 and Lee et al. 2007). The time of outburst was constrained to better than a day by Nishiyama and Kabashima using unfiltered images (first detection with 16.1 mag and last non-detection with lower limit of 18.9 mag on 2007 December 9.528 and 8.574 UT, respectively). Throughout the paper, we use 2007 December 9.0 UT as the time of the outburst. Kasliwal et al. (2010) present a Gunn-g band light curve. The nova was first detected 2.7 days after outburst and monitored during the following 5 days. They give a rate of decline from maximum by one and two magnitudes of 3.5 and >5 days, respectively. Bode et al. (2009a, hereafter BDS2009) report broadband i′, V, B, and narrow-band Hα photometry that began 5.9 days post-outburst and then continued for 23 days producing a fast decay.
Nishiyama and Kabashima determined the position of the nova to RA = 00h43m19 94 ± 001, Dec = + 41°13′46
 6 ± 01 (J2000). Based on observations with the 2-m Liverpool Telescope, BDS2009 confirmed the position (end figures 1997 ± 001 in RA and 463 ± 01 in Dec) applying an astrometric solution to a 2-m Liverpool Telescope Sloan i′-band image using stars from the Two Micron All Sky Survey (2MASS) Catalogue (Cutri et al. 2003). They showed that the position of M31N 2007-12b is inconsistent with the nearby nova M31N 1969-08a. BDS2009 also analyzed Hubble Space Telescope observations of the pre-outburst location of M31N 2007-12b. They found a stellar source positionally coincident with M31N 2007-12b with magnitude and color very similar to the Galactic recurrent nova RS Ophiuchi in quiescence, where the red giant dominates the emission. BDS2009 propose this source as the first nova progenitor system identified in M 31.
From optical spectroscopic data obtained on 2007 December 15, the nova is classified as He/N following the classification scheme of Williams (1992), with a full width at half maximum (FWHM) of the Hα line of ~4500 km s-1 (Shafter 2007, BDS2009). Rudy et al. (2008) also find notably broad lines for a nova in a spectrum taken 2007 December 12. They measure a full width at zero maximum (FWZM) of the Hα line of ~6800 km s-1.
Kong & Di Stefano (2008) reported the discovery of a new X-ray source with the Swift satellite (Gehrels et al. 2004) X-ray telescope (XRT) on 2008 Jan. 13 (36 days after outburst) at RA = 00h43m202,Dec = + 41°13′48″ (J2000) with a 90% error radius of 4.5 arcsec consistent with the position of the optical nova M31N 2007-12b. No source was present at the position in Swift observations on 2007 Dec. 16 (day 8) and Dec. 30 (day 21). The emission of the new source was supersoft (all 48 X-ray photons with energies below 0.8 keV). The source is interpreted as a supersoft transient associated with M31N 2007-12b detected 36 d after the optical outburst.
BDS2009 re-analyzed Swift observations of the field. No source was detected in a Swift observation on 2008 May 13 (day 170, 3σ upper limit about a factor of eight below the outburst count rate). They estimate the mass of the WD in the system to be most likely greater than 1.3 M⊙ and quote that the optical light curve, spectrum, and X-ray behavior are consistent with that of a RN. According to BDS2009, M31N 2007-12b shows the greatest similarities to the supposed Galactic RN V2491 Cyg(of the U Sco variety, Page et al. 2010). This classification would indicate that it is a short period system (orbital period of hours to shorter than a few days) and contradict the optical identification in quiescence of a red giant system (see above, orbital period >100 days to a year, Anupama 2008).
Starting in 2006, we carried out a dedicated optical and X-ray monitoring program of novae and SSSs in the central area of M 312, which also covered M31N 2007-12b. These observations were supplemented with a XMM-Newton target of opportunity (ToO) observation of the M31N 2007-12b field in July 2008 targeted by ourselves to enable the length of the SSS phase to be more accurately constrained. First results from these observations – including the detection of a 1100 s periodicity – were reported by Pietsch (2010) and Orio et al. (2010). In this paper, we discuss the observations in detail concentrating on the X-ray spectra and both the short- and long-term variability of the supersoft X-ray counterpart of M31N 2007-12b.
2. Observations and data analysis
2.1. Optical data
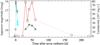 |
Fig. 1 Optical and X-ray light curve of M31N 2007-12b assuming a time of nova outburst of 2007 December 9.0 UT. Optical white light (diamonds) and R filter (triangles) apparent magnitudes are plotted using data from the CBAT M 31 (Apparent) Novae Page and additional Super-LOTIS data (see Sect. 2.1, left y-axis). X-ray luminosities and upper limits derived for an absorbed black-body spectrum, are plotted as squares (see Table 1, right y-axis). Detections are connected with solid lines, and upper limits with dotted lines. Statistical errors in the XMM-Newton EPIC pn data points are smaller than the symbol size. For the four XMM-Newton bright state observations, we also give the bolometric luminosities derived for the WD atmosphere model with solar abundances (stars, see Table 5). |
In addition to the optical observations reported in the introduction, we obtained optical photometric data from Super-LOTIS (Livermore Optical Transient Imaging System, Williams et al. 2008), a robotic 60 cm telescope equipped with an E2V CCD (2 k × 2 k, pixel scale 0.496″/pixel) located at Steward Observatory, Kitt Peak, Arizona, USA. Our data reach a limiting magnitude of ~19 mag in Johnson R. The data were reduced in a semi-automatic routine and photometrically calibrated with the help of the observations of M 31 in the Local Group Galaxy Survey (LGGS, Massey et al. 2006). We achieve typical accuracies of 0.25 mag for Super-LOTIS photometry averaged over the whole magnitude range. From sets of images at 2007 December 14.1, 14.3, 15.1, and 15.3, we determine R magnitudes for M31N 2007-12b of 18.05, 18.32, 18.42, and 18.15, respectively. These data are included in the optical light curve of M31N 2007-12b (Fig. 1), which also shows measurements reported on the CBAT M 31 (Apparent) Novae Page and those of Lee et al. (2007) and Pietsch et al. (2007).
2.2. X-ray data
X-ray observations of the M31N 2007-12b field around and after the optical nova outburst.
XMM-Newton OM and Swift UVOT observations of the M31N 2007-12b field around and after the optical nova outburst.
A Chandra and XMM-NewtonM 31 project monitored novae in the central area of M 31 from November 2007 to February 2008 with observations separated by ten days. It covered the outburst of M31N 2007-12b. Details of observations used are summarized in Table 1. The table lists the telescope and instrument used, the observation identifications (ObsIDs), the observation start times, observation exposure times, and times after optical outburst of the nova. We give count rates, X-ray luminosity in the 0.15–1.0 keV band, and comment on the X-ray brightness. We also report the Swift observations of the field and the additional XMM-Newton ToO observation (ObsID 0560180101) pointed at the position of M31N 2007-12b.
The XMM-Newton (Jansen et al. 2001) observations were performed with the EPIC instruments (Strüder et al. 2001; Turner et al. 2001) in the full frame mode and filters thin and medium for pn and MOS detectors, respectively. For the XMM-Newton data analysis, we used XMMSAS v10.0 tasks and calibration files that had been made public before 2010 August, which included the latest EPIC pn energy redistribution file (v11). For source detection, we rejected times with high background. Sources were simultaneously searched for in 15 images binned to 2″ × 2″ in the energy bands 0.2–0.5,0.5–1,1–2,2–4.5,and 4.5–12 keV,using single and double pixel events for pn (only single pixel events for the 0.2–0.5 keV band) and single to four pixel events for the two MOS detectors. The astrometric accuracy was improved by a pointing offset correction using the catalogue of Chandra HRC-I sources by Kaaret (2002). For a more detailed description, we refer to Henze et al. (2010). In this way, the remaining systematic positional error (which dominates for bright sources) can be reduced to ~0.5″ (1σ). For the timing and spectral analysis of M31N 2007-12b, we only used EPIC pn data since the source was on or close to CCD boundaries in the MOS detectors and because of the higher sensitivity of the pn detector compared to the MOS detectors in the soft energy band. For this analysis, we also accepted times of higher high-energy background as they are not affecting as much the count rates in the soft X-ray bands. To reduce the background we only selected single-pixel events that dominate the energy range covered by SSSs. In the timing analysis, we corrected the event arrival times to the solar system barycenter and created background-corrected light curves. The count rate and upper limits in ObsIDs 0505720201 and 0560180101 were determined with emldetect set to position fixed mode using as an input source list the sources detected in the observation and in addition the position of M31N 2007-12b.
M31N 2007-12b was not detected in the Chandra (Weisskopf et al. 2002) HRC-I (Murray et al. 2000) observations of our monitoring. For these observations, we determined upper limits to the count rate of a source at the nova position.
We analyzed the observations using mission-dependent software as well as the HEAsoft package v6.3, including the spectral analysis software XSPEC v12.3.1. For the XSPEC models, we used the Tübingen-Boulder ISM absorption (TBabs in XSPEC) model together with the photoelectric absorption cross-sections from Balucinska-Church & McCammon (1992) and ISM abundances from Wilms et al. (2000).
2.3. Ultraviolet data
During the XMM-Newton and Swift X-ray observations, M31N 2007-12b was in the field of view of the XMM-Newton optical monitor (OM Mason et al. 2001) and the Swift ultraviolet/optical telescope UVOT. Table 2 indicates the data observatory, instrument, ObsID, filter used, exposure time on M31N 2007-12b, and its brightness or upper limit. No source is detected at the M31N 2007-12b position in the U and ultraviolet (UV) filters six days before the nova outburst. The Swift observation taken eight days after the outburst already shows a bright source at the nova position in the combined UVM2 filter image (166–268 nm), which does not vary significantly in brightness between the four individual images of about equal exposure distributed over ~ 5 h. In the Swift UVM2 filter observation 24 d later, the source had faded by more than 2 mag and was no longer detectable. The OM UVW1 filter (240–360 nm) observations only start 21 d after the outburst. M31N 2007-12bis clearly detected. After 30 d, in this filter the source also faded below detectability.
3. Results
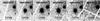 |
Fig. 2 XMM-Newton EPIC pn images (0.2–1 keV) of the area around M31N 2007-12b – from left to right – 21, 30, 41, 50, 60, and 222 days after the optical nova outburst, respectively (see Table 1). |
In the optical, M31N 2007-12b displayed a rapid rise to the outburst maximum (more than 2.5 mag in observations without any filter in one day, according to Nishiyama and Kabashima). Using Lee et al. (2007) and Super-LOTIS data, the decay time by 2 mag in the Johnson R band (t2R) can be constrained to 5 d < t2R < 8 d.Therefore we can classify M31N 2007-12b as a very fast nova (following the speed class scheme of Payne-Gaposchkin 1964).
Position of the SSS correlating with M31N 2007-12b.
In XMM-Newton observations in January and February 2008 starting 30 d after the optical outburst of M31N 2007-12b, a bright source is found to be consistent with the position of the nova (see Table 3) that was not present in the Chandra HRC-I observations in December 2007 or earlier observations. On the basis of the position in the observation 0505720301, we name the source XMMM31 J004319.9+411347. Hardness ratio criteria (see e.g. Pietsch et al. 2005) indicate that the source has to be classified as supersoft. Positional coincidence, time of X-ray outburst, and X-ray softness identify the new X-ray transient as SSS emission from nova M31N 2007-12b. Already 21 days after outburst – in the XMM-Newton observation 0505720201 – the source may be present just above the detection limit (factor of more than 300 below outburst maximum). The XMM-Newton ToO observation in July 2008 suffered from high background. Nevertheless, from the non-detection of the source we derive an upper limit for the source of more than a factor 200 below outburst maximum. Already ~ 50 days earlier in Swift observation 00037719001, M31N 2007-12bis no longer detected. However, the Swift upper limit is less stringent. Figure 2 shows 0.2–1 keV XMM-Newton EPIC pn images of the nova field. Table 1 lists source count rates and absorption-corrected luminosities or corresponding upper limits, respectively. We used the Swift XRT count rates and upper limits for the source given by BDS2009. We also comment on the brightness of M31N 2007-12b. To derive luminosities and upper limits for the observations with too few photons for spectral fitting, we assumed a 60 eV black-body spectrum with an absorption column of 1.0 × 1021 cm-2 as for the best-fit model of observation 0505720301 (see below and Sect. 4). For XMM-Newton observations where the source was bright, we used the results from the absorbed black-body modeling (see below).
Figure 1 also shows the long-term X-ray light curve of M31N 2007-12b. The source brightened between 21 and 30 days after the optical outburst to an un-absorbed luminosity of about 8 × 1038 erg s-1inferred from the assumed black-body parameters. The following data points show a decrease by about a factor of two within 30 days. Unfortunately, on day 60 after the outburst the regular monitoring ended. In addition, we have upper limits from observations 170 and 222 days after the outburst, which clearly indicate that the SSS had been switched off by that time. Extrapolating the intensity from the monitoring observations, the SSS may well have turned off as early as shortly after the end of the regular monitoring.
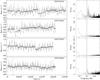 |
Fig. 3 left: XMM-Newton EPIC pn background corrected light curves (0.15–1 keV) of M31N 2007-12b for ObsID 0505720301, 0505720401, 0505720501, and 0505720601 integrated over 100 s (data points with error bars) and 1110 s (shaded, size indicates 1σ error). Time zero corresponds to HJD 245 0000.0 + (4473.2933, 4483.6332, 4492.9356, and 4509.2042), respectively (solar system barycenter corrected). right: XMM-Newton EPIC pn power spectra (0.15–1 keV) of M31N 2007-12b for the same observations. |
Background-corrected EPIC pn light curves of M31N 2007-12b in the 0.15–1 keV band (Fig. 3) clearly show short-term time variability within the observations where M31N 2007-12b was bright. A power spectrum analysis revealed in all observations a significant periodicity around 1100 s. To constrain the period, we fitted to the count rates a constant plus sinusoidal modulation. The derived periods are consistent within the errors with a period of 1110 s that did not vary. Figure 4 shows the light curves in the 0.15–1 keV band folded modulo this period. Table 4 summarizes the periods found. We also give pulsed fractions derived for the total band as well as those sub-divided into the 0.15–0.4 and 0.4–1 keV bands. The pulsed fraction is defined as the ratio of the amplitude of the sine function to the average. The quoted errors correspond to 90% confidence intervals for a single interesting parameter. Pulsed fractions in the sub-bands do not differ significantly from those of the total band. The average pulsed fraction is about 20%. However, there seems to be a slight variation in the pulsed fraction between observations.
To search for residual non-periodic variability in the observations, we superimpose in Fig. 3 the data combined in 1110 s bins. Observations 0505720301, 0505720401, and 0505720501 clearly show dips starting at JD 2450000.0 + (4473.4475, 4483.6717, 4493.0769), respectively. There is no significant hardness ratio variation accompanied by these dips based on the sub-bands mentioned above.
For the four XMM-Newton bright state observations of M31N 2007-12b, we analyzed the X-ray spectrum following the procedures used by Henze et al. (2009) for the characterization of the SSS counterpart of the nova M31N 2007-06bin the M 31 globular cluster Bol 111. To check for spectral variability during individual observations, we investigated hardness ratios resolving the observations in 1110 s bins, and depending on the 1110 s pulse phase. As we found no significant hardness ratio variability, we restricted our analysis to spectra averaged for the individual observations. Table 5 summarizes the best-fit model parameters and derived parameters for black-body and WD atmosphere models. We give the observation identification (ObsID), the effective integration time tint, the raw 0.15–1 keV count rate, the spectral model used, the best-fit absorption column and temperature. The number of energy bins reduced by the number of free parameters defines the degree of freedom ν. The goodness of fit is characterized by χ2/ν. In addition, we give the un-absorbed X-ray luminosity in the 0.15–1 keV band, the bolometric luminosity, and the radius of the emission region. Errors represent the 90% confidence levels.
Black-body models are a very simple approximation for the SSS emission of M31N 2007-12b. They give barely acceptable fits. WD atmosphere models based on more physical assumptions seem to give acceptable fits. We used the “grid of synthetic ionizing spectra for very hot compact stars from NLTE model atmospheres” computed by Rauch (2003) assuming plane-parallel geometry and hydrostatic and radiative equilibrium. The models contain all elements from H to Ca (Rauch 1997). Rauch (2003) used the Tübingen Model-Atmosphere Package (TMAP, Rauch & Deetjen 2003) with elemental abundances fixed to either Galactic halo ([H]3 = [He] = 0, [metals] = –1) or solar ratios. The grids of model atmosphere fluxes, as well as FITS tables that can be used in XSPEC, are available on-line4. The XSPEC tables contain temperatures and fluxes for fixed surface gravity (log g) and elemental abundances. In our case, the available grid parameter space was restricted to models with log g = 9.0, since only these tables include temperatures high enough to fit our spectra. This restriction clearly limits the significance of our best-fit solutions, since models with different surface gravity may have provided equally good fits with different parameters. We also note that the assumption of a plane-parallel and static atmosphere is not physically realistic for a nova. Furthermore, the spectral analysis is limited by the low energy resolution of the EPIC pn spectra. Great caution should therefore be applied when interpreting the results of the fits even when they are formally acceptable. In Fig. 5, we show the EPIC pn spectrum of observation 0505720501 with the best-fit black-body and solar-abundance WD atmosphere models overplotted.
For the black-body model, bolometric luminosities and radii for the emission region directly follow from the normalization parameter of the XSPEC fit. To derive the same parameters for the WD atmosphere fits, we integrated the models across the range 0.005–1.0 keV, the maximum range defined in the XSPEC tables. By comparison with the black-body models, this may lead to an underestimation of the bolometric luminosity by about 1%. The corresponding radii were calculated based on the bolometric luminosity and temperature using formulae as for the black-body models.
The absorbing column needed for the best-fit black-body models is significantly above the Galactic foreground value (NH = 6.6 × 1020 cm-2, Stark et al. 1992) and varies between observations. On the other hand, the best-fit absorbed WD atmosphere models are compatible with the Galactic foreground column. All models indicate a temperature increase of about ~15 eV after observation 0505720301. The bolometric luminosities derived from the WD atmosphere model fits for solar abundances indicate that the luminosity remained high till about day 50 after outburst and then declined (see Fig. 1). The slightly lower luminosity measured at day 21 (ObsID 0505720301) may be caused by a too small correction for foreground absorption (the best-fit NH value is below the Galactic absorbing column).
4. Discussion
On the basis of the positional agreement, the short delay of the X-ray outburst after the optical outburst and the supersoft X-ray spectrum, the emission of XMMM31 J004319.9+411347 has to originate from the nova system M31N 2007-12b. The speed class of the optical light curve, the decay of the UV emission at the onset of the SSS emission, and the start and duration of the SSS phase are consistent with the timescales expected from the universal decline law for classical novae (see Hachisu & Kato 2006, 2010).
We have fitted absorbed black-body and WD atmosphere models. As discussed below, absorbed black-body models seem not to present a physically correct description of the spectra. However, as they are often used to describe other low resolution data we included them for comparison. The peak luminosity of the black-body fits significantly exceeds the Eddington luminosity of a hydrogen-rich atmosphere of a WD ( × 1038 erg s-1).In addition, the absorbing column varies between observations and is well above the Galactic value. This confirms the finding that black-body fits to SSS spectra are known to often result in too high values of NH and too low temperatures, and therefore point to too high luminosities (see e.g. Greiner et al. 1991; Kahabka & van den Heuvel 1997, and references therein).
The WD atmosphere models give physically more plausible results. As indicated by our spectral fits, the resulting NH values are compatible with the Galactic foreground absorption and the luminosity is reduced to more realistic values close to the Eddington limit. In the following discussion, we use the results from the fits with the WD atmosphere model of solar abundance that corresponded to the lowest reduced χ2 values.
4.1. M31N 2007-12b system and outburst parameters
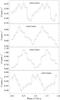 |
Fig. 4 Folded EPIC pn light curves in the 0.15–1 keV band. The panels show the pulse profiles for the different observations.The intensity profiles are background subtracted. Phase zero for all light curves corresponds to HJD 245 4473.0. |
BDS2009 determined a WD mass in the M31N 2007-12b system of MWD ≳ 1.3 M⊙ based on the constraints for the turn-off time for nuclear burning provided by one Swift XRT detection and one upper limit 170 d after nova outburst. Here we add and discuss the results from the dense XMM-Newton and Chandra monitoring that allows a detailed modeling of the M31N 2007-12bsystem and outburst parameters. We can more tightly constrain the time of appearance and the turn-off of the SSS phase to ton = (25 ± 5) d and toff = (115 ± 55) d, respectively. In addition, we can make use of the well-determined temporal development of the X-ray temperature and luminosity. We also discuss the radii of the X-ray emission region during the bright state derived from the EPIC pn spectral fits.
To interpret our measurements, we used the envelope models for post-outburst novae from Sala & Hernanz (2005b). We find an increase in the temperature to 81.5 eV in ObsID 0505720501 and 10 d later a slight temperature decrease accompanied by a drop in luminosity by ~ 35%. In view of the model, this luminosity drop might be associated with the end of the nuclear burning. We can compare the M31N 2007-12b temperature and luminosity development to their Table 2 and Figs. 10 and 11, which present results for five different core masses (from 0.9 to 1.3 M⊙) and four different chemical compositions of the WD envelope due to mixing of the accreted material with the degenerate core. The model parameters do not depend much for similar mixing on whether the accreting object is an ONe or a CO WD. Only models with mixing between 25% and 50% but closer to 25% of solar-like accreted material and the degenerate core seem to explain the data. We note that a similar mixing was needed to model the SSS emission of the Galactic nova V1974 Cyg (Sala & Hernanz 2005a). While different atmosphere models change the observed maximum temperature of ~ 80 eV the WD by a few eV, this temperature determines the WD mass to MWD = (1.20 ± 0.05) M⊙ (see their Fig. 7). This represents a massive WD with a mass significantly below that derived by BDS2009. Our “plateau” bolometric luminosity of about 6 × 10⁴ L⊙ is slightly higher but within the errors consistent with the one predicted by the model (5.2 × 10⁴ L⊙).
Bright state XMM-Newton EPIC pn timing analysis for M31N 2007-12b.
Bright state XMM-Newton EPIC pn spectral best fit parameters and derived parameters for M31N 2007-12b.
The radius of the emission region determined from the fit to the spectrum of ObsID 0505720501 is ~6.4 × 108 cm, i.e. a factor of 1.7 above the radius expected from a 1.2 M⊙ non-magnetic cold WD (Hamada & Salpeter 1961). The discrepancy would be even bigger if we accept the hypothesis that the pulses in the X-ray light curve are caused by WD rotation. The observed emission would have to be in-homogeneously distributed over the WD surface and we therefore would only measure a fraction of the WD surface. However, during the steady hydrogen burning phase (SSS phase) one expects a larger WD photospheric radius, which can be derived from the photospheric temperature (see Hachisu & Kato 2010). For a temperature of 81.5 eV, we find a radius of ≲ 5.0 × 108 cm still slightly below our measured value. Similar radii are predicted by the models from Sala & Hernanz (2005b). For a magnetic WD, even larger photometric radii are expected (an additional radius increase by a factor of up to 1.5 for a 1.2 M⊙ WD, Suh & Mathews 2000).
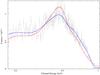 |
Fig. 5 XMM-Newton EPIC pn spectrum of M31N 2007-12b of ObsID 0505720501 with best-fit black-body and NLTE WD atmosphere (solar metal abundance) models overplotted in red and blue, respectively (see Table 5). |
The ejected mass in the M31N 2007-12b outburst can be estimated from both the time of appearance of the SSS and the expansion velocity of the ejected material. As in Henze et al. (2010), we assume the volume of the nova shell, expanding at constant velocity v, to be V ~ 4π × v3 × t3 × f, where the fill factor f is a dimensionless parameter describing the thickness of the shell. We chose f = 0.2, which incorporates the thickness of the envelope due to thermal motions inside the gas (see Della Valle et al. 2002, and references therein). Under this assumption, the column density of hydrogen evolves with time as  , where mH = 1.673 × 10⁻²⁴ g is the mass of the hydrogen atom, and f′ ~ 2.4 is a geometric factor correcting the NH along the line of sight for the case of a shell with fill factor f = 0.2. We assume that the expansion velocity is 2250 km s-1 (half the FWHM measured in the Hα line of the optical spectrum, BDS2009). We also assume that the SSS appears when the absorbing hydrogen column density decreases to ~1021 cm-2. This leads to an ejected mass of
  .
.
The burned mass can be estimated from the turn-off time of the SSS phase as Mburn,H = (Lbol·toff)/(XHϵ), where Lbol is the bolometric luminosity, toff the SSS turn-off time, XH the hydrogen fraction of the burned material, and ϵ = 5.98 × 10¹⁸ erg g-1 (see Sala & Hernanz 2005b; Henze et al. 2010). From the preferred envelope mixing model of Sala & Hernanz (2005b) (see above), we derive XH ≈ 0.5. Assuming the measured “plateau” bolometric luminosity Lbol = 6 × 10⁴ L⊙ and that there was a drop in the X-ray luminosity after 60 days at the end of the SSS phase, we derive Mburn,H = 2.0 × 10⁻⁷ M⊙. However, the drop in the X-ray luminosity after 60 days might not mark the end of the SSS phase but just represent an intensity fluctuation during the “plateau” phase. Unfortunately, the monitoring at intervals of 10 d ended at day 60. We therefore cannot exclude the possibility that the M31N 2007-12b SSS phase only ended shortly before day 170 after the nova outburst when the source was not detected in the Swift observations. The longer burning time would then even allow for a burned mass of ~6.0 × 10⁻⁷ M⊙.
4.2. White dwarf rotation in M31N 2007-12b
The pulsations of the SSS emission of M31N 2007-12b remained constant within the errors at a period of 1110 s during the four observations distributed over 30 days. It therefore most certainly represents the rotation period of the WD in the system. Rotation periods with similar values have been reported for many CVs and specifically for IP systems that had a nova outburst (see e.g. Warner 2002). The 1110 s modulation is the first definite rotational period of a WD found in a M 31 optical nova system.
In CVs containing a magnetic WD, the modulation of the intensity with rotation is explained by brighter spots on the photosphere caused by asymmetric fuel coverage due to magnetic channeling during accretion. This may lead to steady nuclear burning close to the poles if enough matter is accreted producing a SSS. If the accretion is not strong enough – even for a magnetic WD – the accreted matter may not be confined to the poles until explosive nuclear burning sets in at the nova outburst. Therefore, if no significant amount of new H-rich fuel arrives after the nova ignition, nuclear burning will quickly become spherically symmetric (see e.g. discussion in King et al. 2002). It is generally assumed that during the nova explosion an accretion disc in the system is destroyed and accretion onto the WD stops (see e.g. modeling for the RN U Sco, Drake & Orlando 2010). However, Page et al. (2010) argue that in the case of the nova V2491 Cyg the accretion disc was not fully destroyed and accretion resumed as early as 57 days after the explosion. From the lack of pulsations and other considerations, they argue that a magnetic WD is unlikely in the system, a suggestion that had been put forward by Ibarra et al. (2009) based on pre-nova X-ray spectra of V2491 Cyg, and used by Hachisu & Kato (2009) to explain the secondary maximum in the optical light curve of the source. During one XMM-Newton observation of V2491 Cyg, Ness et al. (2011) find – besides a dip – oscillations with a period of 2232 s that are not present during the dip minimum and also not in a second observation. To explain the pulsations of M31N 2007-12b, strong accretion onto a magnetic WD in the system would have had to have set in as early as 30 days after the explosion.
Besides M31N 2007-12b, only one other M 31 nova system has been found to display a periodic modulation of its X-ray emission. Henze et al. (2010) report a ~5900 s period for the SSS counterpart of M31N 2006-04a. Owing to the duration of the observation, only three cycles could be followed. It is unclear whether the period reflects the rotation period of the WD in the system or is connected to the binary orbit.
Periodicities in SSS emission from WDs have been discussed for several Galactic nova systems. Drake et al. (2003) discuss ~2500 s peaks in Chandra observations of the classical nova V1494 Aqlas non-radial g + modes from the pulsating, rekindled WD. Strong modulations with ~35 s have been reported for the RN RS Oph based on selected Swift XRT (Osborne et al. 2006) and Chandra observations (Ness et al. 2007) as a transient phenomenon in the supersoft emission during the outburst. Sala et al. (2008) report a 10 700 s periodicity in XMM-Newton observations of the SSS emission of nova V5116 Sgr, which they explain by partial eclipses by an asymmetric accretion disc. For the Galactic nova V4743 Sgr, Dobrotka & Ness (2010) re-analyzed Chandra and XMM-Newton observations and identified ~1330 s as the WD rotation period.
In M 31, periodicities have been reported for two other SSS. Osborne et al. (2001) detected 865 s pulsations from the supersoft transient source XMMU J004319.4+411759in the center area of M 31, which was only detected in one XMM-Newton observation in June 2000. The authors speculate that the emission could originate from the SSS phase of an optical nova for which the optical outburst was not detected. King et al. (2002) rejected this possibility and postulated that it represents a supersoft IP in M 31. In view of our findings, the SSS phase of an optical nova in M 31 still seems feasible. Trudolyubov & Priedhorsky (2008) detected 217 s pulsations from the bright SSS XMMU J004252.5+411540. The source is detected as a steady, bright SSS close to the center of M 31 starting with the observations of the Einstein observatory. It most likely represents a CV system with steady hydrogen-burning on the surface of the WD similar to the systems detected by ROSAT in the Magellanic Clouds (Trümper et al. 1991; Greiner et al. 1991).
4.3. M31N 2007-12b: an intermediate polar (IP)?
The dips in the M31N 2007-12b light curves may have been caused by occulting material in the binary system and therefore reflect the orbital period of the system. Since we see a dip in three out of four observations but never more than one (see above), the orbital period should be close to the duration of our observations. We can determine the possible orbital period as follows. The time difference between the start time of the dips in ObsIDs 0505720301 and 0505720401, as well as 0505720401 and 0505720501 are 10.2242(128) d and 9.4052(128) d, respectively. The differences must be multiples of the orbital period. In addition, the difference between these differences (0.8190(256) d) has to be a multiple n of the period. These conditions can be fulfilled for n = 2 and n = 4, suggesting periods of 0.4095 d and 0.2047 d (9.828 h and 4.914 h), respectively. Shorter periods are not allowed as they would have lead to a second dip within ObsID 0505720401. Extrapolating both allowed periods to ObsID 0505720601, we would predict the start of a dip at HJD 2454509.3006 (corresponding to 8500 s in Fig. 3). A weak dip may be present at around that time. The proposed periods contradict the identification of a red giant secondary in M31N 2007-12b by BDS2009 which would point to a significantly longer orbital period of the system (see discussion in Sect. 1 and Anupama 2008).
While the 1110 s periodicity is deduced from many cycles and is clearly detected in four epochs, the orbital period derived from three dips in four separated observations, is less certain. We cannot exclude that this variability could also be produced by e.g. variations in accretion rate or occultation due to non-radial motion in the ejecta. However, these effects would be expected to cause more continuous variability and would not normally create dips. However, several IP systems display dips in their X-ray light curve that reflect their orbital period (see e.g. light curves for the IP H2252-035/AO Psc, Pietsch et al. 1987, which also showed pulsations during the dips). Orbital periods of 4.9 h or even 9.8 h as indicated by the dips, are on the long side of – but well within – the distribution of orbital periods of classical Galactic novae (see e.g. Diaz & Bruch 1997). Based on its proposed rotation period of 1110 s and the significantly longer binary period, M31N 2007-12b can be classified as an IP system. Systems with synchronized rotation and binary period (polars) may be de-synchronized in a nova outburst. However, rotation and binary periods should probably not differ by the amount observed for M31N 2007-12b (Warner 2002). The IP interpretation is also supported by the derived radius for the WD photosphere being consistent with that of a magnetic WD. Our observations add M31N 2007-12b as the first extragalactic IP candidate identified with an optical nova to the list of Galactic nova IPs and IP candidates (Warner 2002)5.
5. Summary and conclusions
During our XMM-Newton/Chandra monitoring program of the central area of M 31 to detect SSS emission from optical novae, we have observed the outburst of the He/N nova M31N 2007-12b in several observations with 10 d spacing. In addition, we have analyzed a XMM-Newton target of opportunity observation and included informations from Swift XRT observations. We have performed a source detection, determined the long-term time and spectral variations of M31N 2007-12b, and searched for shorter-term time variability in the individual observations when the source was bright, using fast Fourier and folding techniques to analyze periodicities.
The SSS emission started as early as between 21 and 30 d after the optical outburst and ended between 60 and 120 d after outburst, implying that the nova M31N 2007-12b has one of the shortest SSS phases known. The spectrum was supersoft and can be fitted with a WD atmosphere model with solar abundances absorbed by the Galactic foreground. The temperature of the WD atmosphere seems to increase at the beginning of the outburst from ~70 to ~80 eV. The luminosity of M31N 2007-12b during maximum was at the Eddington limit of a massive WD. It dropped by ~30% in the observation 60 d after outburst. The radius of the emission region is ~6 × 108 cm. Nova envelope models with ≲ 50% mixing between solar-like accreted material and the degenerate core of the WD can be used to describe the data. We derived a WD mass of 1.2 M⊙. From the start time of the SSS emission we determined the ejected mass to be 2.0 × 10⁻⁶ M⊙. If we assume that the drop in luminosity 60 d after outburst indicates the end of the hydrogen burning phase, we can determine the burned mass to be 2 × 10⁻⁷ M⊙. The radius of the emission region is larger than the photospheric radius expected for a non-magnetic WD in a nova system but is in the range expected for magnetic WDs.
In the four bright state observations, we detected a stable 1110 s pulsation that we interpreted as the WD rotation period. In addition, we detected dips in three observations that might point to a 4.9 h or 9.8 h binary period of the system. On the basis of these periodicities together with the indication of a magnetic WD from the photospheric radius, we propose that M31N 2007-12b erupted in an IP system in M 31.
[]: log(abundance/solar abundance)
For an up-to-date catalog of IPs and IP candidates see http://asd.gsfc.nasa.gov/Koji.Mukai/iphome/catalog/alpha.html
Acknowledgments
We wish to thank the referee, Matthew Darnley, for his constructive comments, which helped to improve the clarity of the paper. We acknowledge the use of public data from the Swift data archive. Part of this work was supported by the Sonderforschungsbereich, SFB 375 of the Deutsche Forschungsgemeinschaft, DFG. The XMM-Newton project is supported by the Bundesministerium für Bildung und Forschung / Deutsches Zentrum für Luft- und Raumfahrt (BMBF/DLR) and the Max-Planck Society. M. Henze acknowledges support from the BMWI/DLR, FKZ 50 OR 0405. M. Hernanz acknowledges support from grants AYA2008-01839 and 2009-SGR-315. G.S. acknowledges MICINN grants AYA2008-04211-C02-01 and AYA2010-15685, and funds from ESF EUROCORES Program EuroGENESIS through grant EUI2009-04167.
References
- Anupama, G. C. 2008, in RS Ophiuch (2006) and the Recurrent Nova Phenomenon, ed. A. Evans, M. F. Bode, T. J. O’Brien, & M. J. Darnley, ASP Conf. Ser., 401, 31 [Google Scholar]
- Balucinska-Church, M., & McCammon, D. 1992, ApJ, 400, 699 [NASA ADS] [CrossRef] [Google Scholar]
- Bode, M. F., Darnley, M. J., Shafter, A. W., et al. 2009a, ApJ, 705, 1056 (BDS2009) [NASA ADS] [CrossRef] [Google Scholar]
- Bode, M. F., Osborne, J. P., Page, K. L., et al. 2009b, The Astronomer’s Telegram, 2025, 1 [NASA ADS] [Google Scholar]
- Cutri, R. M., Skrutskie, M. F., van Dyk, S., et al. 2003, The IRSA 2MASS All-Sky Point Source Catalog, NASA/IPAC Infrared Science Archive, http://irsa.ipac.caltech.edu/applications/Gator/ [Google Scholar]
- Della Valle, M., Pasquini, L., Daou, D., & Williams, R. E. 2002, A&A, 390, 155 [NASA ADS] [CrossRef] [EDP Sciences] [Google Scholar]
- Diaz, M. P., & Bruch, A. 1997, A&A, 322, 807 [NASA ADS] [Google Scholar]
- Dobrotka, A., & Ness, J. 2010, MNRAS, 405, 2668 [NASA ADS] [Google Scholar]
- Drake, J. J., & Orlando, S. 2010, ApJ, 720, L195 [NASA ADS] [CrossRef] [Google Scholar]
- Drake, J. J., Wagner, R. M., Starrfield, S., et al. 2003, ApJ, 584, 448 [NASA ADS] [CrossRef] [Google Scholar]
- Gehrels, N., Chincarini, G., Giommi, P., et al. 2004, ApJ, 611, 1005 [NASA ADS] [CrossRef] [Google Scholar]
- Greiner, J., Hasinger, G., & Kahabka, P. 1991, A&A, 246, L17 [NASA ADS] [Google Scholar]
- Hachisu, I., & Kato, M. 2006, ApJS, 167, 59 [NASA ADS] [CrossRef] [Google Scholar]
- Hachisu, I., & Kato, M. 2009, ApJ, 694, L103 [NASA ADS] [CrossRef] [Google Scholar]
- Hachisu, I., & Kato, M. 2010, ApJ, 709, 680 [NASA ADS] [CrossRef] [Google Scholar]
- Hachisu, I., Kato, M., & Luna, G. J. M. 2007, ApJ, 659, L153 [NASA ADS] [CrossRef] [Google Scholar]
- Hamada, T., & Salpeter, E. E. 1961, ApJ, 134, 683 [NASA ADS] [CrossRef] [Google Scholar]
- Henze, M., Pietsch, W., Haberl, F., et al. 2009, A&A, 500, 769 [NASA ADS] [CrossRef] [EDP Sciences] [Google Scholar]
- Henze, M., Pietsch, W., Haberl, F., et al. 2010, A&A, 523, A89 [NASA ADS] [CrossRef] [EDP Sciences] [Google Scholar]
- Holland, S. 1998, AJ, 115, 1916 [NASA ADS] [CrossRef] [Google Scholar]
- Ibarra, A., Kuulkers, E., Osborne, J. P., et al. 2009, A&A, 497, L5 [NASA ADS] [CrossRef] [EDP Sciences] [Google Scholar]
- Jansen, F., Lumb, D., Altieri, B., et al. 2001, A&A, 365, L1 [NASA ADS] [CrossRef] [EDP Sciences] [Google Scholar]
- Jośe, J., & Hernanz, M. 1998, ApJ, 494, 680 [NASA ADS] [CrossRef] [Google Scholar]
- Kaaret, P. 2002, ApJ, 578, 114 [NASA ADS] [CrossRef] [Google Scholar]
- Kahabka, P., & van den Heuvel, E. P. J. 1997, ARA&A, 35, 69 [NASA ADS] [CrossRef] [Google Scholar]
- Kasliwal, M. M., Cenko, S. B., Kulkarni, S. R., et al. 2011, ApJ, submitted [arXiv:1003.1720] [Google Scholar]
- King, A. R., Osborne, J. P., & Schenker, K. 2002, MNRAS, 329, L43 [NASA ADS] [CrossRef] [Google Scholar]
- Kong, A. K. H., & Di Stefano, R. 2008, The Astronomer’s Telegram, 1360, 1 [NASA ADS] [Google Scholar]
- Kotak, R. 2008, in RS Ophiuch (2006) and the Recurrent Nova Phenomenon, ed. A. Evans, M. F. Bode, T. J. O’Brien, & M. J. Darnley, ASP Conf. Ser., 401, 150 [Google Scholar]
- Lee, C.-H., Ries, C., Riffeser, A., & Seitz, S. 2007, The Astronomer’s Telegram, 1324, 1 [NASA ADS] [Google Scholar]
- MacDonald, J., & Vennes, S. 1991, ApJ, 373, L51 [NASA ADS] [CrossRef] [Google Scholar]
- Mason, K. O., Breeveld, A., Much, R., et al. 2001, A&A, 365, L36 [NASA ADS] [CrossRef] [EDP Sciences] [Google Scholar]
- Massey, P., Olsen, K. A. G., Hodge, P. W., et al. 2006, AJ, 131, 2478 [NASA ADS] [CrossRef] [Google Scholar]
- Murray, S. S., Austin, G. K., Chappell, J. H., et al. 2000, in X-Ray Optics, Instruments, and Missions III, ed. J. E. Truemper, & B. Aschenbach, SPIE Conf. Ser., 4012, 68 [Google Scholar]
- Ness, J., Starrfield, S., Beardmore, A. P., et al. 2007, ApJ, 665, 1334 [NASA ADS] [CrossRef] [Google Scholar]
- Ness, J., Drake, J. J., Beardmore, A. P., et al. 2009, AJ, 137, 4160 [NASA ADS] [CrossRef] [Google Scholar]
- Ness, J., Osborne, J. P., Dobrotka, A., et al. 2011, ApJ, 733, 70 [NASA ADS] [CrossRef] [Google Scholar]
- Orio, M., Nelson, T., Bianchini, A., Di Mille, F., & Harbeck, D. 2010, ApJ, 717, 739 [NASA ADS] [CrossRef] [Google Scholar]
- Osborne, J. P., Borozdin, K. N., Trudolyubov, S. P., et al. 2001, A&A, 378, 800 [NASA ADS] [CrossRef] [EDP Sciences] [Google Scholar]
- Osborne, J., Page, K., Goad, A. B. M., et al. 2006, The Astronomer’s Telegram, 770, 1 [Google Scholar]
- Page, K. L., Osborne, J. P., Evans, P. A., et al. 2010, MNRAS, 401, 121 [NASA ADS] [CrossRef] [Google Scholar]
- Patterson, J. 1994, PASP, 106, 209 [NASA ADS] [CrossRef] [Google Scholar]
- Payne-Gaposchkin, C. H. P. 1964, The galactic novae, ed. Gaposchkin C. H. P. (New York: Dover Publication) [Google Scholar]
- Pietsch, W. 2010, Astron. Nachr., 331, 187 [NASA ADS] [CrossRef] [Google Scholar]
- Pietsch, W., Voges, W., Kendziorra, E., & Pakull, M. 1987, Ap&SS, 130, 281 [NASA ADS] [CrossRef] [Google Scholar]
- Pietsch, W., Freyberg, M., & Haberl, F. 2005, A&A, 434, 483 [NASA ADS] [CrossRef] [EDP Sciences] [Google Scholar]
- Pietsch, W., Burwitz, V., Henze, M., Morales, N., & Nomen, J. 2007, The Astronomer’s Telegram, 1329, 1 [NASA ADS] [Google Scholar]
- Poole, T. S., Breeveld, A. A., Page, M. J., et al. 2008, MNRAS, 383, 627 [NASA ADS] [CrossRef] [Google Scholar]
- Rauch, T. 1997, A&A, 320, 237 [NASA ADS] [Google Scholar]
- Rauch, T. 2003, A&A, 403, 709 [NASA ADS] [CrossRef] [EDP Sciences] [Google Scholar]
- Rauch, T., & Deetjen, J. L. 2003, in Stellar Atmosphere Modeling, ed. I. Hubeny, D. Mihalas, & K. Werner, ASP Conf. Ser., 288, 103 [Google Scholar]
- Rudy, R. J., Lynch, D. K., Prater, T. R., et al. 2008, IAU Circ., 8907, 3 [NASA ADS] [Google Scholar]
- Sala, G., & Hernanz, M. 2005a, A&A, 439, 1057 [NASA ADS] [CrossRef] [EDP Sciences] [Google Scholar]
- Sala, G., & Hernanz, M. 2005b, A&A, 439, 1061 [NASA ADS] [CrossRef] [EDP Sciences] [Google Scholar]
- Sala, G., Hernanz, M., Ferri, C., & Greiner, J. 2008, ApJ, 675, L93 [NASA ADS] [CrossRef] [Google Scholar]
- Shafter, A. W. 2007, The Astronomer’s Telegram, 1332, 1 [Google Scholar]
- Stanek, K. Z., & Garnavich, P. M. 1998, ApJ, 503, L131 [NASA ADS] [CrossRef] [Google Scholar]
- Stark, A. A., Gammie, C. F., Wilson, R. W., et al. 1992, ApJS, 79, 77 [NASA ADS] [CrossRef] [Google Scholar]
- Starrfield, S., Iliadis, C., & Hix, W. 2008, in Classical Novae, ed. Bode M. F., & Evans A., 2nd edn., Cambridge Astrophys. Ser., 43 (Cambridge: Cambridge University Press), 77 [Google Scholar]
- Strüder, L., Briel, U., Dennerl, K., et al. 2001, A&A, 365, L18 [NASA ADS] [CrossRef] [EDP Sciences] [Google Scholar]
- Suh, I., & Mathews, G. J. 2000, ApJ, 530, 949 [NASA ADS] [CrossRef] [Google Scholar]
- Trudolyubov, S. P., & Priedhorsky, W. C. 2008, ApJ, 676, 1218 [NASA ADS] [CrossRef] [Google Scholar]
- Trümper, J., Hasinger, G., Aschenbach, B., et al. 1991, Nature, 349, 579 [NASA ADS] [CrossRef] [Google Scholar]
- Turner, M. J. L., Abbey, A., Arnaud, M., et al. 2001, A&A, 365, L27 [NASA ADS] [CrossRef] [EDP Sciences] [Google Scholar]
- Warner, B. 2002, in Classical Nova Explosions, ed. M. Hernanz, & J. José, AIP Conf. Ser., 637, 3 [Google Scholar]
- Weisskopf, M. C., Brinkman, B., Canizares, C., et al. 2002, PASP, 114, 1 [NASA ADS] [CrossRef] [Google Scholar]
- Williams, R. E. 1992, AJ, 104, 725 [NASA ADS] [CrossRef] [Google Scholar]
- Williams, G. G., Milne, P. A., Park, H. S., et al. 2008, in GAMMA-RAY BURSTS 2007, ed. M. Galassi, D. Palmer, & E. Fenimore, AIP Conf. Ser., 1000, 535 [Google Scholar]
- Wilms, J., Allen, A., & McCray, R. 2000, ApJ, 542, 914 [NASA ADS] [CrossRef] [Google Scholar]
- Yaron, O., Prialnik, D., Shara, M. M., & Kovetz, A. 2005, ApJ, 623, 398 [NASA ADS] [CrossRef] [Google Scholar]
All Tables
X-ray observations of the M31N 2007-12b field around and after the optical nova outburst.
XMM-Newton OM and Swift UVOT observations of the M31N 2007-12b field around and after the optical nova outburst.
Bright state XMM-Newton EPIC pn spectral best fit parameters and derived parameters for M31N 2007-12b.
All Figures
|
Fig. 1 Optical and X-ray light curve of M31N 2007-12b assuming a time of nova outburst of 2007 December 9.0 UT. Optical white light (diamonds) and R filter (triangles) apparent magnitudes are plotted using data from the CBAT M 31 (Apparent) Novae Page and additional Super-LOTIS data (see Sect. 2.1, left y-axis). X-ray luminosities and upper limits derived for an absorbed black-body spectrum, are plotted as squares (see Table 1, right y-axis). Detections are connected with solid lines, and upper limits with dotted lines. Statistical errors in the XMM-Newton EPIC pn data points are smaller than the symbol size. For the four XMM-Newton bright state observations, we also give the bolometric luminosities derived for the WD atmosphere model with solar abundances (stars, see Table 5). |
| In the text | |
|
Fig. 2 XMM-Newton EPIC pn images (0.2–1 keV) of the area around M31N 2007-12b – from left to right – 21, 30, 41, 50, 60, and 222 days after the optical nova outburst, respectively (see Table 1). |
| In the text | |
|
Fig. 3 left: XMM-Newton EPIC pn background corrected light curves (0.15–1 keV) of M31N 2007-12b for ObsID 0505720301, 0505720401, 0505720501, and 0505720601 integrated over 100 s (data points with error bars) and 1110 s (shaded, size indicates 1σ error). Time zero corresponds to HJD 245 0000.0 + (4473.2933, 4483.6332, 4492.9356, and 4509.2042), respectively (solar system barycenter corrected). right: XMM-Newton EPIC pn power spectra (0.15–1 keV) of M31N 2007-12b for the same observations. |
| In the text | |
|
Fig. 4 Folded EPIC pn light curves in the 0.15–1 keV band. The panels show the pulse profiles for the different observations.The intensity profiles are background subtracted. Phase zero for all light curves corresponds to HJD 245 4473.0. |
| In the text | |
|
Fig. 5 XMM-Newton EPIC pn spectrum of M31N 2007-12b of ObsID 0505720501 with best-fit black-body and NLTE WD atmosphere (solar metal abundance) models overplotted in red and blue, respectively (see Table 5). |
| In the text | |
Current usage metrics show cumulative count of Article Views (full-text article views including HTML views, PDF and ePub downloads, according to the available data) and Abstracts Views on Vision4Press platform.
Data correspond to usage on the plateform after 2015. The current usage metrics is available 48-96 hours after online publication and is updated daily on week days.
Initial download of the metrics may take a while.