Fig. 1
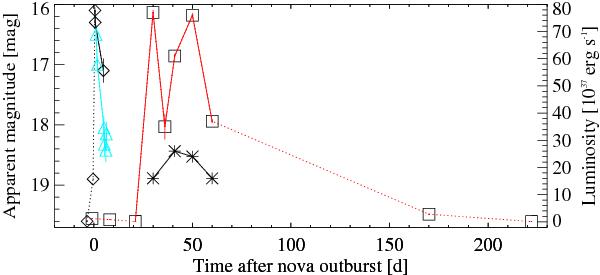
Optical and X-ray light curve of M31N 2007-12b assuming a time of nova outburst of 2007 December 9.0 UT. Optical white light (diamonds) and R filter (triangles) apparent magnitudes are plotted using data from the CBAT M 31 (Apparent) Novae Page and additional Super-LOTIS data (see Sect. 2.1, left y-axis). X-ray luminosities and upper limits derived for an absorbed black-body spectrum, are plotted as squares (see Table 1, right y-axis). Detections are connected with solid lines, and upper limits with dotted lines. Statistical errors in the XMM-Newton EPIC pn data points are smaller than the symbol size. For the four XMM-Newton bright state observations, we also give the bolometric luminosities derived for the WD atmosphere model with solar abundances (stars, see Table 5).
Current usage metrics show cumulative count of Article Views (full-text article views including HTML views, PDF and ePub downloads, according to the available data) and Abstracts Views on Vision4Press platform.
Data correspond to usage on the plateform after 2015. The current usage metrics is available 48-96 hours after online publication and is updated daily on week days.
Initial download of the metrics may take a while.