Fig. 8
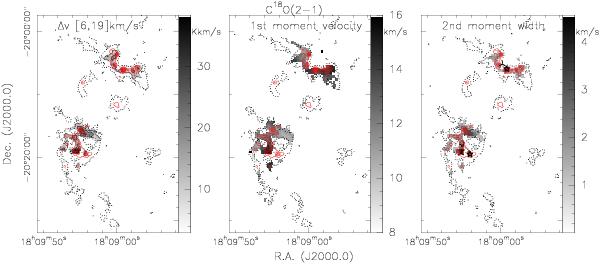
The grey-scale shows C18O(2–1) moment maps: 0th moment or integrated intensity on the left, 1st moment or intensity-weighted velocity in the middle and 2nd moment or intensity-weighted linewidth to the right. The black contours in the left panel show the integrated C18O(2–1) data and go from 20 to 80% in 20% steps. The dotted contours outline the 875 μm emission at a 3σ level from Fig. 1, and the red contours show additionally the high-intensity 875 μm emission in 15σ steps from 15σ onwards (1σ ≈ 70 mJy beam-1). In the right panel, the 3-pointed stars in the north and south mark the position of an O-star by Bik et al. (2005) and the center of the southern cluster discussed by Blum et al. (2001). The 5-pointed stars mark the two UCHii regions (Wood & Churchwell 1989).
Current usage metrics show cumulative count of Article Views (full-text article views including HTML views, PDF and ePub downloads, according to the available data) and Abstracts Views on Vision4Press platform.
Data correspond to usage on the plateform after 2015. The current usage metrics is available 48-96 hours after online publication and is updated daily on week days.
Initial download of the metrics may take a while.