Free Access
Fig. 7
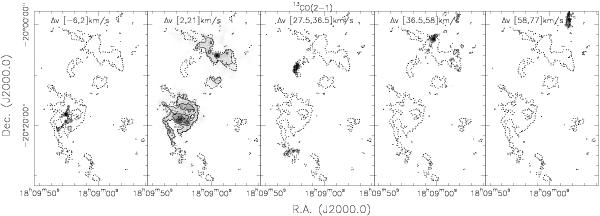
The grey-scale shows different 13CO(2–1) integrated intensity images where the integration regimes are shown in the top of each panel. Contour levels go from 20 to 80% in 20% levels of the respective peak intensities. The dotted contours outline the 875 μm emission at a 3σ level from Fig. 1.
Current usage metrics show cumulative count of Article Views (full-text article views including HTML views, PDF and ePub downloads, according to the available data) and Abstracts Views on Vision4Press platform.
Data correspond to usage on the plateform after 2015. The current usage metrics is available 48-96 hours after online publication and is updated daily on week days.
Initial download of the metrics may take a while.