Free Access
Fig. 6
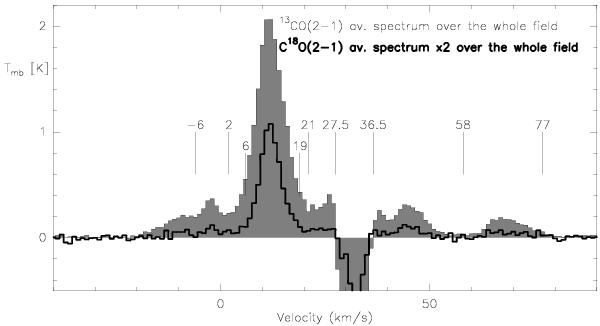
13CO(2–1) and C18O(2–1) (multiplied by a factor 2) spectra averaged over the entire W31 region. The marked velocities show the different velocity regimes used for the 13CO (upper) and C18O (lower) moment maps.
Current usage metrics show cumulative count of Article Views (full-text article views including HTML views, PDF and ePub downloads, according to the available data) and Abstracts Views on Vision4Press platform.
Data correspond to usage on the plateform after 2015. The current usage metrics is available 48-96 hours after online publication and is updated daily on week days.
Initial download of the metrics may take a while.