Fig. 3
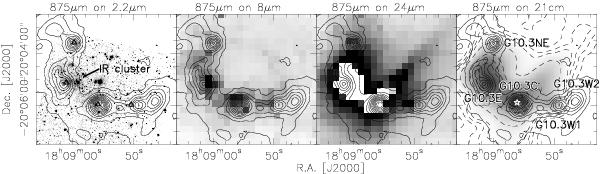
Zoom into the G10.3 complex. In all 4 panels the solid contours present the 875 μm continuum contours (start at 3σ and continue in 9σ steps, 1σ ≈ 70 mJy beam-1) whereas the grey-scale shows other wavelength data as outlined over each panel. The dashed 21 cm contours in the right panel go from 15 to 60 mJy beam-1 in 15 mJy beam-1 steps, and from 120 to 840 mJy beam-1 in 240 mJy beam-1 steps. The K-band data are taken from Bik (2004). The white central part of the 24 μm image is saturated. The triangles in the left panel mark the Class ii CH3OH maser positions from Walsh et al. (1998). The white star in the right panel marks the position of an UCHii region (Wood & Churchwell 1989), and the additional labels there name sources discussed in the main text.
Current usage metrics show cumulative count of Article Views (full-text article views including HTML views, PDF and ePub downloads, according to the available data) and Abstracts Views on Vision4Press platform.
Data correspond to usage on the plateform after 2015. The current usage metrics is available 48-96 hours after online publication and is updated daily on week days.
Initial download of the metrics may take a while.