Fig. 2
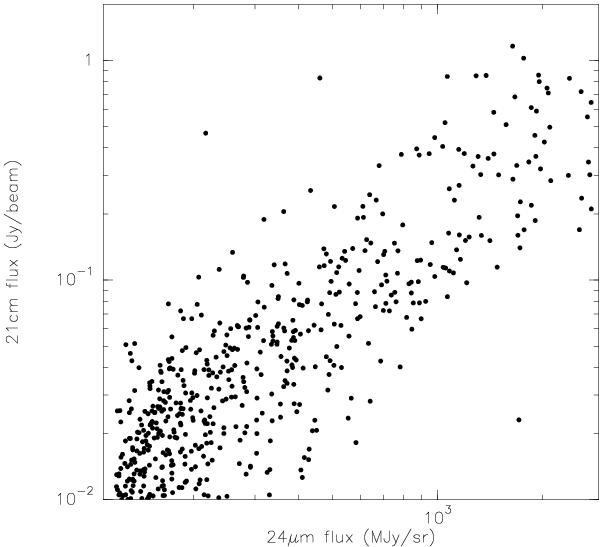
Correlation between 24 μm fluxes and 21 cm fluxes for the W31 complex. Only pixels with 24 μm flux above 120 MJy sr-1 (corresponding to the approximate outskirts of the Hii regions) and 21 cm emission above the 3σ level of ~ 0.01Jy beam-1 are plotted. Furthermore, only correlations on scales of the beam size of the 21 cm observation were used (2-pixel steps corresponding to 29′′).
Current usage metrics show cumulative count of Article Views (full-text article views including HTML views, PDF and ePub downloads, according to the available data) and Abstracts Views on Vision4Press platform.
Data correspond to usage on the plateform after 2015. The current usage metrics is available 48-96 hours after online publication and is updated daily on week days.
Initial download of the metrics may take a while.