Fig. 11
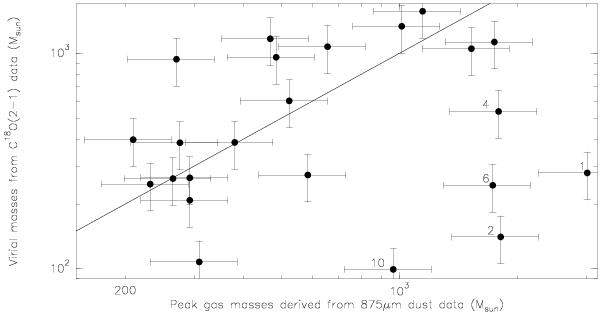
Comparison of masses derived from the 875 μm dust continuum as well as via the C18O(2–1) line width under the assumption of virial equilibrium at the same spatial resolution of 27.5′′. We draw 25% error-bars although the real errors may be even larger as discussed in the main text. The solid line marks the 1:1 relation. The numbers in the bottom-right part correspond to the clumps discussed in the main text and marked in Fig. 4.
Current usage metrics show cumulative count of Article Views (full-text article views including HTML views, PDF and ePub downloads, according to the available data) and Abstracts Views on Vision4Press platform.
Data correspond to usage on the plateform after 2015. The current usage metrics is available 48-96 hours after online publication and is updated daily on week days.
Initial download of the metrics may take a while.