Fig. 1
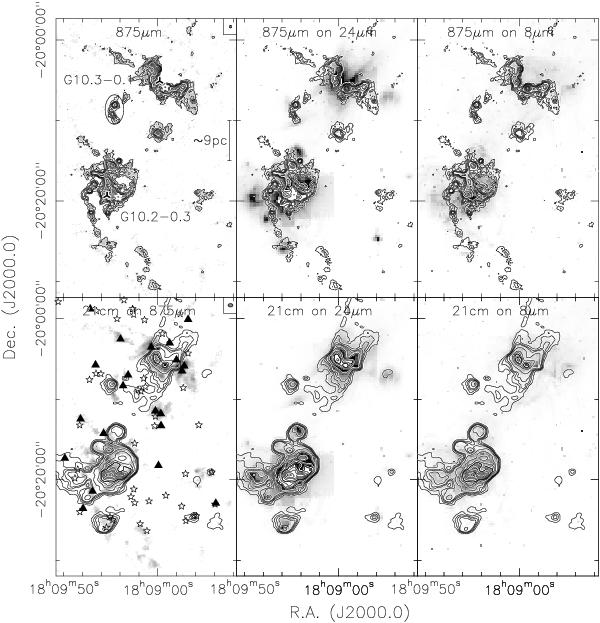
Continuum images of the W31 region. The shown wavelengths are marked in each panel. The 875 μm data are contoured in 3σ steps from 3 to 12σ and continue in 15σ steps from 15σ onwards (1σ ≈ 70 mJy beam-1). The 21 cm image is contoured in 3σ steps from 3 to 12σ (1σ ≈ 5 mJy beam-1), continuing in 0.24 Jy beam-1 steps from 0.12 to 0.84 beam-1, and then go on in 0.48 beam-1 steps. The 24 μm map is saturated toward the peak positions. In the top-left panel the 3-pointed stars mark the position of an O-star by (Bik et al. 2005) and the approximate center of the southern infrared-cluster discussed by Blum et al. (2001). The two white 5-pointed stars show the positions of UCHii regions (Wood & Churchwell 1989). The ellipse marks the emission that velocity-wise is associated with cloud complexes outside our field of view (Sect. 3.2). A scalebar is shown in the top-left panel. The 875 μm and 21 cm beam sizes are shown in the top-right corners of the top-left and bottom-left panels, respectively. In the bottom-left panel, the triangles and stars show IRAC-identified protostellar class 0/I (the two classes are combined) and class II candidates, respectively, following Allen et al. (2004); Megeath et al. (2004); Qiu et al. (2008).
Current usage metrics show cumulative count of Article Views (full-text article views including HTML views, PDF and ePub downloads, according to the available data) and Abstracts Views on Vision4Press platform.
Data correspond to usage on the plateform after 2015. The current usage metrics is available 48-96 hours after online publication and is updated daily on week days.
Initial download of the metrics may take a while.