| Issue |
A&A
Volume 531, July 2011
|
|
|---|---|---|
| Article Number | A135 | |
| Number of page(s) | 12 | |
| Section | Stellar structure and evolution | |
| DOI | https://doi.org/10.1051/0004-6361/201116579 | |
| Published online | 01 July 2011 | |
Periodicity search as a tool for disentangling the contaminated colour light curve of CoRoT 102781750⋆
1
Konkoly Observatory of the Hungarian Academy of Sciences, Konkoly-Thege M. u 15-17, 1121 Budapest, Hungary
e-mail: paparo@konkoly.hu
2
Observatoire de la Côte d’Azur, Université Nice Sophia-Antipolis, UMR 6525, Parc Valrose, 06108 Nice Cedex 02, France
3
Institute of Astronomy, University of Vienna, Türkenschanzstrasse 17, 1180 Vienna, Austria
4
LESIA, Université Pierre et Marie Curie, Université Denis Diderot, Observatoire de Paris, 92195 Meudon Cedex, France
Received: 25 January 2011
Accepted: 10 May 2011
Context. The CoRoT space mission (COnvection, ROtation and planetary Transits) launched in December 2006, aims at finding transiting exoplanets and investigating stellar oscillation in adjacent stellar fields, called exo- and seismofields, respectively. Besides the seismofields, CoRoT has a strong potential for seismological research on the exofields. Up to now, only a limited number of RR Lyrae stars have been classified among the CoRoT targets. Knowing the astrophysical importance of the RR Lyrae stars, we attempted to get useful information even from a contaminated light curve of a possible RR Lyrae pulsator.
Aims. The star CoRoT 102781750 reveals a puzzle, showing a very complex and altering variation in different “CoRoT colours”. We established without doubt that more than a single star was situated within the CoRoT mask. Using a search for periodicity as a tool, our aim is to disentangle the composite light curve and identify the type of sources behind the variability.
Methods. Both flux and magnitude light curves were used. Conversion was applied after a jump- and trend-filtering algorithm. We applied different types of period-finding techniques including MuFrAn and Period04.
Results. The amplitude and phase peculiarities obtained from the independent analysis of CoRoT r, g, and b colours and ground-based follow-up photometric observations ruled out the possibility of either a background monoperiodic or a Blazhko type RR Lyrae star being in the mask. The main target, an active star, shows at least two spotted areas that reveal a Prot = 8.8 h (f0 = 2.735 c d-1) mean rotation period. The evolution of the active regions helped to derive a period change of dP/dt = 1.6 × 10⁻⁶ (18 s over the run) and a differential rotation of α = ΔΩ/Ω = 0.0074. The 0ṃ015 linear decrease and a local 0ṃ005 increase in the dominant period’s amplitude are interpreted as a decay of the old spotted region and an appearance of a new one, respectively. A star that is detected only in the CoRoT b domain shows a f1 = 7.172 c d-1 pulsation connected to a 14ḍ83 periodicity via an equidistant triplet structure. The best explanation for our observation is a β Cep star with a corotating dust disk.
Key words: stars: variables: RR Lyrae / stars: individual: CoRoT 102781750 / stars: oscillations / stars: activity / circumstellar matter / space vehicles
© ESO, 2011
1. Introduction
The French-led CoRoT space mission (Baglin et al. 2006; Auvergne et al. 2009), dedicated to asteroseismology and exoplanetary research, allows us to discover new details of the inner layers of pulsating stars, exoplanets, and many other exotic objects. CoRoT collects photometric time series data from adjacent stellar fields: it observes a few (defocused) bright stars (< 10) in the seismofields and a large number of fainter stars (~104) in the exofields. Data obtained both on the seismo- and exofields give us the possibility to broaden our knowledge on pulsating stars. The signal-to-noise ratio one can obtain for the bright seismofield targets (brightness range of 5.5–9 mag) allows detailed investigation of the low-amplitude, non-radial oscillations of the main sequence stars. Excellent papers on new results have been published in the special CoRoT issue of A&A on solar-like oscillation (HD 49933 Appourchaux et al. 2009; Benomar et al. 2009, HD 181906 Garcia et al. 2009), on δ Scuti stars (HD 50844 Poretti et al. 2009), on β Cephei stars (HD 180642 Degroote et al. 2009), and on Be stars (HD 49330 Huat et al. 2009; HD 50209 Diago et al. 2009).
Photometric data of the CoRoT targets and possible contaminating stars (B-F).
It was recognized early on that a number of research fields in stellar physics can benefit from the extremely precise time-series photometry of the exofield targets (magnitude range: 11–16) (Baglin et al. 2000; Weiss et al. 2004). The less frequent (8 min) default sampling combined with the large number of collected photons is ideal for monitoring variable stars with periods longer than a few hours. Unfortunately, up to now only a few dominantly radially pulsating RR Lyrae stars have been classified in the exofields. This is not surprising, however, since the CoRoT exoplanet fields are biased toward cool main sequence stars due to the CoRoT target selection procedure (Debosscher et al. 2009). The recently published CoRoT target, V1127 Aql (Chadid et al. 2010), is the first RR Lyrae star continuously observed over 5 consecutive Blazhko cycles. A previously unknown complexity of the side lobe structure, up to the sepdecaplet structure, was identified within a total amount of 450 peaks in the frequency spectrum. The CoRoT data of the Blazhko type RR Lyrae star, CoRoT 101128793, which has recently been investigated (Poretti et al. 2010), suggest the presence of some non-radial modes besides the two radial modes and their linear combinations.
The CoRoT 102781750 was classified by the automatic CoRoT Variable Classifier (CVC, Debosscher et al. 2009) to be an RR Lyrae star with a probability of 67%, SPB type with 25%, and Be star with 6%. The uncertainty in classification suggests contamination of neighbouring stars. Due to the high probability of the star belonging to the RR Lyrae class, the data of CoRoT 102781750 was assigned to the CoRoT RR Lyrae working group (Chadid et al. 2009). Given that all classifications for the star represent pulsation, we used a periodicity search as a tool for disentangling the contaminated light curve of CoRoT 102781750. In our analysis we benefitted from the brightness of the target (B = 14.9, V = 14.1), which allowed us to have “CoRoT colours” for the contaminated star. We attempted to disentangle the composite light curve and find the type of the sources behind the variability.
2. Observations and data processing
To achieve the scientific goal of the exoplanet search programme, thousands of stars were observed simultaneously. The continuous light curves supplied a photometric precision that was typically a factor 100 better than Hipparcos and OGLE data (Sarro et al. 2009). The CoRoT target, CoRoT 102781750 ( ,
,  ) was observed during the first Long Run in the anti-centre direction (LRa01) from October 24, 2007 to March 3, 2008, i.e., over a time span of 131 days. According to Exo-Dat1, the CoRoT/Exoplanet input catalogue (Deleuil et al. 2009), its brightness and colour index are B = 14.939 and B − V = 0.841, and its spectral type is K2V. The Exo-Dat catalogue gives Teff = 5050 K for the temperature and E(B − V) = 0.05 for the colour excess. More photometric data are given in Table 1.
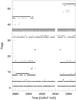 |
Fig. 1 Distribution of non-zero flag measurements in the raw data of CoRoT 102781750: energetic particles (1), crossing of SAA (4 and 32), Earth eclipse inward (8) or outward (16), and their combinations. After removal, 70.2% of the original measurements were analysed. |
2.1. Raw data
With the 8-min time sampling, generally used on the exofields, 21 219 measurements were gathered and delivered to us on N2 (science grade) level after reduction with the CoRoT pipeline (Samadi et al. 2006; Auvergne et al. 2009). The pipeline (in our case pipe_version: 0.6) contains corrections for electronic offset, gain, electromagnetic interference, outliers, background, and jitter. Additionally, flags were attributed (N2_version: 1.4) to measurements affected by one of a few instrumental effects (e.g., energetic particles (1), crossing SAA (South Atlantic Anomaly) (4 and 32), perturbation by Earth eclipse inward (8), or outward (16)). The distribution of the measurements with non-zero flags is presented in Fig. 1. CoRoT time is given as HJD−2 451 544.5. Different flag values are the combination of these basic effects (e.g. 36 = 32 + 4 or 37 = 32 + 4 + 1 at our case). It is quite understandable that high-energy particles and the disturbance because of the SAA can appear at anytime during the run. However, the effect of the Earth eclipse has no impact in the middle of the observing run over 30–35 days. In our analysis we only used the valid zero-flag measurements (71.4%).
After removing the obvious outliers, about 14 900 measurements (70.2% of the raw data) were used in our analysis. Usually for other CoRoT targets only about 10% non-zero flag measurements are obtained. We analysed the non-zero flag measurements to find any regularity (e.g., binarity), but we failed. We cannot pinpoint any obvious reason for discarding such a high percentage of the raw data for our analysis.
2.2. CoRoT colours
In exoplanet research, the distinction between intrinsic stellar brightness variations (chromatic) and a planetary transit (achromatic) is a critical point. Therefore, for stars on the exofield chromatic information is taken with a bi-prism located close to the exoplanet CCD. Because of the prism and the astigmatism aberration, the point spread function (PSF) is a very low-resolution spectrum (Rouan et al. 1999). The PSF exhibits an elongated shape with a typical size of 15 × 10 pixels, which corresponds to about 35 × 23 arcsec. The optimal photometric mask used in the photometric on-board reduction (so-called template) fits the unusual shape of stars’ images. To this end the assigned template consider the temperature and colour indices of the target, its position on the CCD, and the position of possible contaminating stars. The template is selected from a set of 256 predefined templates optimizing the signal-to-noise ratio of the target’s integrated flux (Barge et al. 2006).
The two prisms, each made with a proper glass and angles, so that the mean wavelength is not deviated but the blue extends to the left and the red to the right (Léger et al. 2006), enable spatial discrimination of contaminated stars (Barge et al. 2008). The spectrum is split by a proper selection of pixels into three spectral bands whose fluxes are recorded independently. The boundaries between the colours are arbitrary, and the final setting was based on stellar field simulations in the preparatory phase. To get the best spatial discrimination for contaminated planetary transit light curves, the following optimum distribution was set: 20% of the bluest photons are assigned to the blue channel and 65% of the reddest photons to the red channel. The remaining photons constitute the green flux, which is transmitted independently as well, in order to measure the total flux (Rouan et al. 1999). However, the actual fraction of the colour fluxes depends on the target. The white light is kept constant over the observing run. The coloured fluxes are very sensitive to depointing fluctuations of the satellite, not only because of the lower number of pixels but also because of the chromatic contamination (Samadi et al. 2006). Any shift in the spectrum will transfer signal across the border from one colour to the other. Any change in the flux measured by each channel corresponds to a redistribution of the flux within the mask, since the total flux remains constant.
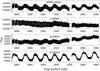 |
Fig. 2 Zero-flag flux curves for the different colours. White flux was kept constant. The trends in the colour curves are the redistribution of flux over the colour borders due to the depointing fluctuations of the satellite. |
CoRoT 102781750 was observed in colours. The photometric mask (templ_ID:91) was 11 pixels long in the S-N (X) direction and 7 pixels wide in the E-W (Y) direction. The first position of the window was 1165 and 1934 pixels in the X and Y directions, respectively. The total number of pixels in the template is 63. Out of that, 37 (59%) are attributed to the red, 7 (11%) to the green, and 19 (30%) pixels to the blue region. The location of the right edge of the blue part is at four pixels, while the location of the left edge of the red part is at six pixels.
The zero-flag data are presented in Fig. 2. The white fluxes (top panel) do not show any trend. The decrease in red flux (2695 units) and the increases of the green (g) (1075 units) and blue (b) colour fluxes (1273 units) can be attributed to the redistribution of fluxes over the colour border. By calculating moving averages, the redistribution was localized at around CoRoT HJD 2924. The colour ratios to the total flux are 79% in r, 9% in g, and 12% in b colour for our target. A similar distribution of flux (73% in red, 11% in green, and 16% in blue) in a K0V star into 3 channels is given by Léger et al. (2009) in his Fig. 10.
The apparently different shapes of colour light curves cannot originate in the same (either pulsating, eclipsing, or active) star, therefore suggesting a severe contamination and needing different data processing for each colour.
Since we were primarily interested in the RR Lyrae type variation clearly seen in the r colour, we removed the long-period variation from the g and b colours. Due to the different appearances of the g and b colour light curves, the data processing had to be done differently. In the g colour, the long-period variability only has a 0.02 mag amplitude compared to the dominant behaviour in the b colour which amounts to 0.2 mag. A moving boxcar method (Chadid et al. 2010) was used to get rid of the trends and jumps in the r colour. At the same step the fluxes were converted to magnitude. A similar step was used for the fluxes in the g colour using proper widths for the boxcar. However, this method did not work in the b colour. No proper value was found for the boxcar to get rid of the long-period variability. Finally we applied a preprocessing of the fluxes. Three frequencies (0.0674, 0.0563, and 0.0777 c d-1) were prewhitened from the fluxes in order to remove the large amplitude variation, then the trend- and jump-filtering algorithm and the magnitude conversion was used for the residual flux curve.
3. Contamination of CoRoT 102781750
As a result of the CoRoT preparatory work, i.e., the target selection process, the Exo-Dat catalogue contains all the information on the target stars, as well as on their environments. This allows us to know the contamination of the stars in the fields in advance. For CoRoT 102781750, a low contamination value of 0.0240795 is given in the catalogue. Three objects are mentioned in the vicinity of our target. For the sake of clarity their photometric parameters, positions on the CCD, and their relative distance to the target star are given in the upper part of Table 1. They are fainter than the target and are not closer than 40″ (the CoRoT scale is  /pixel, see the last column of Table 1). The photometric masks in the two top panels of Fig. 3 (left: CoRoT 102781750, Win_ID: 2539, templ_ID: 91 and right: CoRoT 102780084, Win_ID: 1615, templ_ID: 138) clearly show that indeed the masks of the close-by Exo-Dat objects do not overlap, and no contamination is caused by these far-away stars. The low contamination level given by the Exo-Dat catalogue is consistent with this fact. However, the different appearance of the colour light curves suggests severe contamination.
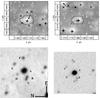 |
Fig. 3 Map of the possibly contaminating stars, CoRoT 102781750 (upper left), CoRoT 102780084 (upper right) as seen by the CoRoT satellite. (Position of stars contained in the Exo-Dat database and USNO-A2 catalogue are marked by plus signs “+” and crosses “ × ”, respectively). The closer neighbourhoods of CoRoT 102781750 in DSS (lower left) and Konkoly observation (lower right) are shown. The star CoRoT 102781750 is marked by A in each panel. Data of the stars labelled by A-F are given in Table 1. |
The lower panels in Fig. 3 show the closer vicinity of our target (A) on a DSS frame (left) and on a CCD frame obtained at the mountain station of Konkoly Observatory (right). The stars B, C, D, E and F are situated at or near the edge of the photometric mask, marked by “ × ” on the top left panel. Their photometric parameters and positions in pixels (obtained from the template) are given in the lower part of Table 1. Although the most nearby stars are faint, they are definitely candidates for possible sources of contamination, because, due to the prism, stars outside of the CoRoT mask can contribute to the measured flux. The relatively large PSF of CoRoT with larger axes approximately in the S-N direction and the large aperture mask (in our case 11″ × 7″) raise the possibility that some of the neighbouring stars may contaminate the light curve of CoRoT 102781750.
Fortunately, a complete set of J, H, K values from the 2MASS catalogue (Skrutskie et al. 2006) was available, enabling a raw estimation of the spectral types of the neighbouring stars. Comparing J − H, H − K and J − K colour indices to the values of Bessel & Brett (1988), our conclusion is that the stars marked with B, C and E are mid-K type main sequence or giant stars, while F has an even later spectral type, being an M3 giant. We did not find any JHK photometry for star D, since it is the only blue star in the vicinity of our target. The lower part of Table 1 contains blue and red photometry taken from the USNO B catalogue at two different epochs and in different passbands (B1, R1, B2, R2) (Monet et al. 2003; Sesar et al. 2006). The accuracy of the catalogue is low, but not worse than 0ṃ5. The star marked with E shows a rather unusual photometric behaviour, which may be an error.
As part of the ground-based follow-up programme, a limited number of control measurements (BVRI) were obtained with a Princeton Instruments VersArray:1300B back-illuminated CCD camera attached to the 1-m RCC telescope on January 11, 2010 at Piszkéstető, the mountain station of Konkoly Observatory. A 200 × 200 pixels window of the combined CCD frames (with a 0.3033 arcsec/pixel resolution) is given in the lower right panel of Fig. 3. Comparing the instrumental colour indices (B − V, V − R, R − I), we can confirm our estimation for the spectral types based on 2MASS colours. The stars marked with B, C, and F have colours similar to our target star (A). D is a very blue star, while the star marked with E has unusual colour indices: its B − V index suggests a very red star, while the V − R and R − I indices do not confirm the extremely red colour. There is no definite conclusion on the spectral type of star E.
To further constrain the nature of the possible contaminating stars, we obtained time-series photometric observations with the same camera and telescope, but without filter, on March 6 and 8, 2011 at Piszkéstető. Three hours of observations were gathered on both nights, which would allow us to detect RR Lyrae type variation in any of the targets despite the rather large seeing (3–5″). However, the stars A-F were constant within the error on these nights. The upper limit of the variation is 0.01 mag for the bright star A, and 0.05–0.1 mag for the fainter targets (B-F).
Due to their position to the left of the main target, there are two candidates that may contaminate the CoRoT blue colour of the main target: a blue star (D) and a red star (E). The photons from both stars (even the red part of their flux) can be measured in the b colour channel of the main target due to the prisms in the optical path. The closest candidate is definitely the star (D) with spectral type B.
4. Frequency analysis
A standard frequency analysis was done independently for each colour with the software package MuFrAn (Kolláth 1990). Investigations for amplitude and phase variability, and for significance and errors were obtained with Period04 (Lenz & Breger 2005).
4.1. Results for the r colour
4.1.1. Fourier parameters
The CoRoT r colour exhibits the RR Lyrae type pulsation in the clearest way. However, the usually accepted multifrequency analysis, improving all the Fourier parameters at the same time in each step, turned out to be meaningless for the whole data set. After finding the dominant peak and its first harmonic, a third frequency appeared so close to the dominant frequency that the amplitudes were influenced by each other. The amplitude of the main frequency decreased compared to the single peak solution and the third frequency’s amplitude was unrealistically high. This is a typical symptom of unresolved closely-spaced frequencies or of a real amplitude variation of a single frequency. In any case, the standard multi-frequency solution cannot be used to find the realistic Fourier parameters of more than two frequencies.
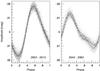 |
Fig. 4 Light curve in the r colour folded with the main pulsation period separately for the beginning (left) and the end (right) of the observing run. Continuous and dashed lines show the first and last cycles of the subset. |
The whole data set was divided into subsets in order to investigate a possible amplitude variability. The separation of the subsets was connected to special features in the raw data as shown in Fig. 2. (CoRoT HJD 2853–2939, 2853–2916, 2853–2913, 2943–2983, and 2916–2983). A jump appeared at CoRoT HJD 2913 and a gap at CoRoT HJD 2943. Through such a subdivision, any possible technical origin can be excluded or traced.
Results of the frequency analysis of CoRoT 102781750 for each colour.
Figure 4 shows the folded light curves before the jump (left panel) and after the gap (right panel). The first and the last cycles of the subsets are also shown in the panels depicting the evolution of the light curve. There is no large difference at the beginning but a substantial change can be seen at the end. The amplitude of the light variation is obviously higher at the beginning and the shape of the light curve is remarkably distorted at the end. The early appearance of the distortion as a bump evolves to a broad minimum. It does not appear at a constant position as in monoperiodic RR Lyrae stars (Paparó et al. 2009). We definitely can exclude the case of a monoperiodic RR Lyrae variation without any further check. If we suppose that the distortion is due to the bump, the migration (earlier bump phase to light maximum and later to the minimum) contradicts the bump migration behaviour generally observed in Blazhko RR Lyrae stars (Guggenberger & Kolenberg 2006).
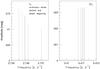 |
Fig. 5 Frequency solution for five subsets and the whole data for the main frequency (left) and for its harmonic (right). The harmonic shows a constant amplitude, while the dominant mode’s amplitude is obviously decreasing. |
The Fourier parameters of the main frequency and its harmonics are plotted for the finally accepted subsets in Fig. 5 (frequencies and amplitudes) and in Fig. 6 (phases). The exact values are given in Table 2 for the beginning (left columns), for the end (right), and for the whole data set (middle). The P0 = 0ḍ36551 period fits the pulsation period of the Blazhko RR Lyrae stars. If the RR Lyrae type pulsation is attributed to a background star contaminated by the main target, it is understandable why the amplitude of the pulsation is so low (0ṃ04 in r and 0ṃ08 both in g and b, the modulation amplitude is about 0ṃ015) and why we only see the first harmonic. A simple calculation shows that, when taking the USNO B and R magnitudes into account (Table 1), the resulting low amplitude (and amplitude variation) is consistent with the A+F or A+B+C blending scenarios.
Some additional effects can be obvious from the graphical representation (Fig. 5). As for the frequencies, the separate subset solutions are within the ± 0.0038 c d-1 error bar of the frequency resolution for the whole data set based on the Rayleigh frequency of a 131-day long observing run. Although the Rayleigh resolution is regarded in most cases as a dramatic overestimation of the real uncertainty (Kallinger et al. 2008), its application assures that our results are not over-interpreted. Nevertheless, the frequency values obtained at the beginning (dotted lines) or at the end (dashed lines) of the observing run show systematic arrangement around the whole data’s solution (continuous line). The higher frequency value at the end means a shorter period with an 18 s difference compared to the period at the beginning. At the same time the “let it free” solution of the first harmonic (when harmonics are determined as independent frequencies) shows much a narrower distribution with an opposite inner behaviour compared to the beginning and the end.
If we regard the 18 s variation in the pulsation period as a period change, a dP/dt = 1.6 × 10⁻⁶value is derived. Apart from the abrupt changes, two types of continuous period change may be expected in RR Lyrae stars. Evolutionary period change is much slower (Le Borgne et al. 2007) than this value. The period change connected to the Blazhko modulation is usually faster than the value presented here, although slower modulations have been also reported (Poretti 2001).
The amplitude variation of the main frequency and its harmonic is shown in Fig. 5. While the amplitude of the main frequency is steadily decreasing, the much lower amplitude of the harmonics keeps a constant value. No similar systematics were reported on Blazhko type RR Lyrae stars for the main period and its harmonic.
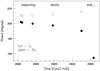 |
Fig. 6 Phase behaviour of the main frequency and its harmonic for five subsets and for the whole run. The main frequency’s phase reveals a sharp drop at the end of the run. |
The phases obtained with MuFrAn, using the frequency solution of a given subset, are shown in Fig. 6 for the main frequency (full circles) and for its harmonic (open circles). The difference between the appropriate subset values (with an epoch at CoRoT HJD 2853 for each) is getting larger (from 10 to 70 degrees) close to the end of the run with a large drop in the main frequency’s phase after the gap. Period change can be ruled out as an explanation, since only a period change of two orders of magnitude would cause the large phase change that is observed.
As control cases, the monoperiodic CoRoT RR Lyrae star (CoRoT 101370131) and the CoRoT Blazhko type (V1127 Aql) RR Lyrae star were investigated for their phase behaviour in subsets. Neither the phase of the main period nor the first harmonic deviated more than 3–4 degrees in the monoperiodic star. In V1127 Aql, the phase difference is larger at maximum and only a few degrees at Blazhko minimum. The ever-changing Blazhko type RR Lyrae CoRoT star 105288363 shows a periodic phase difference of the main period and its first harmonic between only 29.8–36.7 degrees connected to the Blazhko period (Guggenberger et al. 2011). No significant changes were found in the epoch-independent phase difference for RR Gem, a Blazhko type RR Lyrae star (Jurcsik et al. 2005b). The development of the bump in our target stems from the increasing phase difference between the main period and its harmonic.
To summarize, the amplitude ratio of the main frequency and its harmonic in the CoRoT r colour changes between R21 = 0.196–0.313 from the beginning to the end with a R21 = 0.231 value for the whole data set. The phase difference is changing between 9° and  from the beginning to the end with a
  value for the whole data set. The equivalent epoch independent phases are φ21 = 4.482–6.360 in r, 4.473–6.256 in g, and 4.373–6.114 in the b colours given in radian. For comparison, we present here the R21 = 0.417, φ21 = 2.365 values for Blazhko RR Lyrae stars obtained by the MACHO survey (Alcock et al. 2003). A change of R21 over the Blazhko cycle (between 0.4–0.55 for SS For and 0.45–0.55 for RR Lyr) has been published (Kolenberg et al. 2009, 2006). The amplitude ratio, the phase difference, and their variations with a possible Blazhko period do not concur with the general behaviour of the Blazhko RR Lyrae stars.
The residual light curve prewhitened by two frequencies still shows some variability as shown in the upper panel of Fig. 7. To get a residual with a constant average level, we continued a step-by-step frequency search using the traditional significance criterium, S/N > 4 (Breger et al. 1993). These frequencies are presented as separate sets in Table 2. The final residual light curve (lower panel in Fig. 7) has a zero average with a scatter ± 0ṃ0019, as predicted by Auvergne et al. (2009) for a V = 14m brightness star (0ṃ0015 − 0ṃ0016).
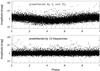 |
Fig. 7 Folded residual light curves after prewhitening with 2 (upper panel) or 12 frequencies (bottom panel). The final residual scatter agrees with the predicted value for a CoRoT target of similar brightness. |
Frequency separations reflecting a period comparable to the length of the data set and its fractions suggest that these peaks are only the manifestation of an overall amplitude variability of the main frequency during the observing run. The number of step-by-step frequencies in a certain subset depends on the complexity of the amplitude variation over the actual timebase.
The first-order side peaks deserve more attention as they are rather asymmetric in amplitude. The highest amplitude side peak appears on the right side (period is shorter than the mean period by 233 s) at the beginning, but at the end the left side peak (period is longer than the main period by 213 s) has the highest amplitude. Blazhko modulation leads to a complex side lobe structure from triplet (AR Her; Smith et al. 1999 or RR Gem; Jurcsik et al. 2005a) to sepdecaplet structure (V1127 Aql; Chadid et al. 2010) in the Fourier spectrum. The side lobes are not exactly equidistant, and the left and right side peaks can differ in amplitude with the extreme case of a vanishing side lobe structure on one side (Jurcsik et al. 2005b). Most Blazhko RR Lyrae stars investigated so far have a complex but static side lobe structure over a given Blazhko cycle. Migration of the highest side peak from one side of the main frequency to the other on such a short time scale has never been reported.
The f + /f0 ratio at the beginning is 1.007, f − /f0 is 0.9978 for the whole data and f − /f0 is 0.9933 at the end of the observing run. Frequency ratios between 0.95 and 1.05 were reported on Blazhko RR Lyrae stars (Moskalik & Poretti 2003) in the OGLE database. Much closer frequency ratios (between 0.99 and 1.01 and between 0.999 and 1.001 as well) were ascribed to long and very long unresolved Blazhko effects (Poretti 2001). However, a change in the frequency ratio due to the migration of side lobes has never been reported.
The amplitude ratios are A + /A0 = 0.0713, A − /A0 = 0.167 and A − /A0 = 0.0988 for the beginning, the entire data set and the end, respectively. These values are at the lower limit of the 0.1 < A ± /A0 < 0.3 range obtained by MACHO data (Alcock et al. 2003).
The Q parameter (Alcock et al. 2003), denoting the asymmetry in the triplet structure, is remarkably changing over the observing run (0.4 at the beginning and − 0.24 for the whole data set but cannot be derived at the end owing to the low value of A + reflecting an even higher negative value for the end than we obtained for the whole data set). For MACHO RR Lyrae stars, the most probable distribution of Q lies in the Q ≈ 0.1–0.6 range with a peak at 0.3 (Alcock et al. 2000).
The spacing and the non-equidistance of the side lobes do not provide strong support for the possibility that one of our background stars is a Blazhko type RR Lyrae star. However, on the basis of these data, we cannot rule out the possibilty of a Blazhko star with a modulation period longer than the length of the observing run. The modulation periods of Blazhko stars range from several tens to several hundred times the pulsation period (ranges from 5.3–533 days) (SS Cnc; Jurcsik et al. 2006, and RS Boo; Nagy 1998).
Although some of the representative parameter values (f ± /f0, A ± /A0 and Q) do not differ drastically from the typical value of Blazhko type RR Lyrae stars, the other parameters (R21, φ21, the side lobe values) and especially their migration do not fit the background Blazhko type RR Lyrae scenario.
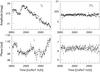 |
Fig. 8 Fine-scale amplitude and phase behaviour of the main frequency (left) and its harmonic (right) obtained by Period04. The harmonic does not show amplitude and phase variation. A 0ṃ015 amplitude decrease with a 0ṃ005 local increase are shown in the main periodicity. The straight increase in the phase of f0 is equivalent to the phase difference between the main frequency and its harmonic. |
4.1.2. Amplitude variation
In addition to the heuristic results obtained by the standard Fourier analysis of different subsets, the amplitude and phase variability on a fine scale (subdivided to one-day long time strings) was derived with Period04 and presented in Fig. 8. Amplitudes (upper panels) and phases (lower panels) of f0 and 2f0, along with their error bars, are plotted as a function of time. The harmonic does not show any variability either in amplitude or in phase. However, the main frequency exhibits a definite variation in amplitude. The total amplitude decrease is 0ṃ015 over the whole observing run with a local 0ṃ005 increase between CoRoT HJD 2880–2890. The dates of the local increase do not correspond to any of the mentioned technical effects. To be sure that the amplitude variability is not caused by any step in the data processing the flux values were also checked. The amplitude variability was also found with the same slope.
An apparent amplitude variability can be caused by two closely spaced, interacting frequencies (Breger & Pamyatnykh 2006). In that case a similar amplitude and phase variation appears with a certain phase shift between them (it is 90° in the case of equal amplitudes).
Although the main frequency shows a structural phase variation over the run (lower left panel of Fig. 8), its appearance does not follow the amplitude variability curve ruling out the closely spaced frequencies as a reason of the amplitude variability. A finer structure of the phase behaviour is given because of the higher time resolution than in Fig. 6. The steady change at the end of the data set, from CoRoT HJD 2950 onwards, agrees in value with the phase change shown in Fig. 6 (taking into account the different definition of phase in MuFrAn and Period04).
The most remarkable result of this investigation is the steady decline of the amplitude with a local increase. The slope of the amplitude variability is similar before and after the local increase. If we take the value of the amplitude variability as a Blazhko modulation amplitude (half or one third of the pulsation amplitude), the prediction (large modulation amplitude for short pulsation period), is not broken. Based on a survey of about 900 RR Lyrae stars (Jurcsik et al. 2005b) MAX(fm) = 0.125f0 − 0.142 gives the shortest Blazhko modulation cycles, in our case it is 5 days. A longer Blazhko period than the length of the run cannot be excluded. However, a 0.005 mag local increase in the Blazhko modulation amplitude has never been reported in Blazhko type RR Lyrae stars.
4.2. RR Lyrae type variation in g and b colours
The RR Lyrae type variation shows similar behaviour in g and b to what we discussed for the r colour. The result of the Fourier analysis is given in Table 2. Both the frequency and amplitude ratios of the main peak and the first-order side peaks are slightly different in value but similar in trend for g and b to what we discussed in the r colour. The amplitude variability is similar in all three colours (0.015, 0.017, and 0.017 values are in r, g, and b, respectively). The main period’s change is 17.2 s in g and 15.4 s in b towards shorter periods. The first order side peaks are shorter by 227 s and 235 s at the beginning, however, they are longer by 227 s and 200 s at the end in the g and b colours, respectively. The change in the mean period decreases from the r to b colour, reflecting the colour dependence, but the first order side peaks behave in a similar way.
It is worthwhile mentioning the colour amplitude ratio of the main periodicity. Ag/Ar = 1.395, 1.413, and 1.457, and Ab/Ag = 0.977, 0.989 and 1.029 values were obtained for the beginning, the whole data, and for the end of the run, respectively. The amplitudes are remarkably larger in g than in r and practically the same in the g and b colours. Although the values do not differ very much, there seems to be an increase from the beginning to the end both in Ag/Ar and Ab/Ag.
Unfortunately, the CoRoT colours do not match the Johnson-Cousins B, V, R bands exactly and they are not calibrated, so we cannot compare the Ag/Ar and Ab/Ag ratios to the AV/AR (=1.23) and AB/AV (=1.30) values obtained for RR Lyrae stars (Jurcsik et al. 2006).
4.3. Additional periodicity in the g and b colours
An additional f1 = 7.173 c d-1 (P = 3.3 h) periodicity, which is presented in Table 3, appeared in both the g and b colours. Its amplitude is close to the significance level in g.
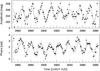 |
Fig. 9 Long-term modulation in the amplitude and phase of f1. Both time scales belong to the same star/stellar system. |
Additional frequencies in the g and b colours.
However, it appears as the second largest amplitude periodicity with a triplet structure in b (Table 3). The triplet is equidistant with a 0.067 c d-1 spacing reminding us of one of the frequencies that we used in prewhitening of the flux curve in b colour (0.0674, 0.0563, and 0.0777 c d-1). The two additional frequencies in Table 3, found above the significance level with a +0.0094 and −0.0115 c d-1 spacing to f1, are connected via a similar spacing to the other frequencies of the preprocessing step. However, it is worthwhile emphasizing that the triplet structure of the additional periodicity appearing in the light curve developed from the residual b flux curve. A straightforward conclusion is that the triplet structure of the short-term pulsation and the long-term light variation, dominant in the b colour, are connected.
The amplitude and phase variation of f1 obtained with Period04 using a 1-day long time resolution are shown with the error bars in Fig. 9. The phase shift between the maximum of the amplitude and phase ranges from 7% to 13% of the long-term periodicity. It is highly unlikely that the modulation with the same period as the long-term variability is coincidentally caused by closely spaced frequencies. A distinct period search around the maximum and minimum of the long-term periodicity confirmed that only the additional periodicity has a different amplitude, while the RR Lyrae type pulsation does not. The parameters of the single sine fits are given in Table 4. The imperfect fit (a need for the second periodicity) is clearly seen, especially in the phase curve (given in Table 4, too).
The close connection of the two types of variability strongly suggest that they are the intrinsic light variation in a single star or a stellar system.
Fitting parameters of the amplitude and phase modulation curves, presenting a new detailed approach to describing the triplet structure.
4.3.1. Long-period light variation
Knowing all the “disturbing pulsations” in the b colour, we separated the long-period light variation to derive its particular features. The original b colour flux data converted to magnitude were prewhitened with the frequencies given in Table 2 for b colours (5 frequencies) and the triplet in Table 3. The resulting, clean long-term variation was analysed. The frequency analysis resulted in the same frequencies (see Table 5) as in the preprocessing phase, which is not surprising. Besides the frequency and period values, the amplitudes and phases are also given in Table 5. The periodicities have practically a 2- or 3-day equidistant spacing, taking an uncertainty in resolving three frequencies from a comparatively short timebase into account (nine cycles during 131 days). However, for a continuous data set, it is surprising that the spacing is exactly an integer multiple of the day. Similar uncertainties (cycle/day aliases) usually appear in ground-based, single-site observations. We do not see any obvious technical reason for these aliases.
After computing the moving average of 25 consecutive photometric points we folded the light curve with the 14.83 days period (Fig. 10). The top left panel shows nine cycles together, demonstrating clearly that the cycles are not exactly repetitive. The lower left panels, continued on the right from top to bottom, give a detailed comparison of the consecutive cycles with overlaps. A given cycle is shown in two consecutive panels, first by a continuous and then by a dashed line. Besides the small irregularities, some clear features can be easily identified.
Fourier parameters of the long-period light variation.
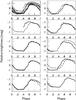 |
Fig. 10 Long-term variability in b colour without the pulsation. Consecutive cycles are not repetitive. The most remarkable feature is the unevenly long, flat part of the cycles. |
The most remarkable feature is the practically constant part of the cycles at minimum over the 0.2–0.3 phase range (with an increase after a decrease in length). The starting point of the rising branch is rather sharp in contrast to the end of the descending branch. The cycles have a broad maximum with slightly decreasing brightness over a time interval similar to the constant part in the minimum. A similar regularity seems to exist in the decrease in the brightness and in the increase in its duration. It is worthwhile mentioning the horn or standstill appearing before the maximum brightness.
Finally, we conclude that the long-period variability is not strictly repetitive from cycle to cycle, as we would expect in a simple eclipsing binary system in which the variation is caused by a simple geometric effect.
5. Discussion
5.1. RR Lyrae type pulsation: pro and contra
We summarize our conclusions in favour of a background RR Lyrae star and against it. The period we detected in the data agrees with the shortest period RRab stars. Its low amplitude can be explained by the contamination. The lower amplitude and distortion of the light curve at the end of the run recalls Blazhko RR Lyrae stars. The Blazhko modulation period may be much longer than the length of the data set. The f ± /f0 and A ± /A0 ratios are not exceptional.
However, the local maximum seen on the descending branch of the light curve towards the end of the observing run (Fig. 4) does not look like the bump in RR Lyrae light curves. The migration of the bump from an earlier pulsation phase (near maximum Blazhko phase – highest light curve amplitude) to a later pulsation phase (near minimum Blazhko phase – lowest light curve amplitude) does not follow the RR Lyrae scheme. The main periodicity varies (18–15 s) on a short timescale, presenting much faster (dP/dt = 1.6 × 10⁻⁶) period variation than evolutionary, but much slower than most Blazhko modulation changes. A large abrupt increase in the phase difference between the main frequency and its harmonics is not known in RR Lyrae stars. The highly constant amplitude of the first harmonic contradicts the typical decrease found in Blazhko type RR Lyrae stars. The R21 is much lower and φ21 is very different from the values obtained for either monoperiodic or for Blazhko RR Lyrae stars. The change in sign of the Q parameter from the beginning to the end of the run; i.e., the different location of the higher amplitude side peak (from right (beginning) to left (end)) is a basic argument against the background RR Lyrae hypothesis. A local increase of 0.005 mag in the amplitude variation of the main frequency cannot be interpreted in the frame of the contaminated background RR Lyrae star. However, the low-amplitude light variation is a well-established fact.
Our strongest argument against the RR Lyrae interpretation is given by our ground-based photometric observations taken on two nights (see Sect. 3.). These data essentially rule out RR Lyrae type variations in the nearby, possibly contaminating, stellar candidates (B-F), as well as in any unresolved contaminating star in the immediate vicinity of our main target (A).
5.1.1. Stellar activity – spotted star
If the RR Lyrae type pulsation is not caused by a contaminated background RR Lyrae star, then we are faced with a more probable situation where the main target, of spectral type K2, shows a light variation with a periodicity similar to the period of an RR Lyrae pulsator. Late type stars with convective envelopes are all affected by magnetic processes that give rise to a rich variety of phenomena on their surface (Donati et al. 2006). Thousands of stars were discovered showing rotational modulation due to star spots through different surveys (OGLE – Guinan et al. 1997; Woźniak et al. 2002; ASAS – Pojmanski 2002; MOST – Croll et al. 2006; Walker et al. 2003, 2007; CoRoT – Lanza et al. 2009a,b, 2010, 2011).
If the low-amplitude variability is caused by surface phenomena, such as spots, then it reflects the rotational period of the star and the peculiarities of the star spot region. A variation of a few hundredths of a magnitude due to spots is typical for active stars. According to its light variation, CoRoT 102781750 is more active than the Sun, like the CoRoT planet-hosting star 2a (Lanza et al. 2009a), with ≈ 20 times greater modulation than that of the Sun during the 11 year cycle. Its activity is between CoRoT-Exo-2a (0.06) and CoRoT-Exo-6a (0.027) (Lanza et al. 2009a, 2011). The P = 0ḍ3655 period is not exceptional if we regard it as a rotational period. The excellent review of star spots by Strassmeier (2009) presents a list of late type stars with Doppler images. Similar or even shorter rotational periods are listed for W UMa system (YY Eri), for single star (RXJ1508.6) and for a K3V spectral type weak-lined T Tauri (WTTS) star (HD 197890: Teff = 5000 K, Prot = 0ḍ380, vequ = 156.3 km s-1, R = 1.2 R⊙).
In this interpretation, the main period (P0 = 0ḍ36551) gives the rotational period of the average spotted area. The harmonic (Prot/2) may represent a second, equally-spaced spot group or the fact that the rotation of the averaged spotted area departs from a pure sine wave (Queloz et al. 2009). The phase change between the main period and its harmonic (≈ 60°) can be interpreted as a change in the separation of the two active longitudes.
The amplitude decrease of the light curve from the beginning to the end (Fig. 4) can be attributed to a decay in a spotted region located at phase 0.8 (right panel). Slightly before and definitely by CoRoT HJD = 2943 a new spotted region appears at phase 0.5. The slight decrease in length of the main period (dP/dt = 1.6 × 10⁻⁶), caused by the evolution of the spotted region to a faster-rotating position (latitude) on the star, is comparable to the dP/dt = 1.5 × 10⁻⁶ obtained for UZ Lib, interpreted as a probable indication of dependency on the activity cycle (Oláh et al. 2003).
Measurements of the rotational period of stars with spots allow the detection of differential surface rotations. If there are star spots at different latitudes, then the difference of the longest and shortest periods observed can be taken as an estimate of the averaged amount of surface differential rotation. Any kind of one-dimensional, disk-integrated data, like time series photometry, cannot resolve the ambiguity of whether the polar or the equatorial regions rotate faster or slower (Strassmeier 2009).
Of course, the final conclusion has to be confirmed by other methods, such as Doppler imaging or line profile analysis. We can, however, come to some conclusion based on our own Fourier analysis and the distinct peculiarity of the continuous, high-precision CoRoT light curve producing a direct tracking of the active regions.
The Fourier analysis revealed the dominant period (P0 = 0ḍ365568 and P0 = 0ḍ365359 for the beginning and the end, respectively) of the highest concentration of the spotted area. We found additional side peaks, which we can attribute to the rotation of a larger independent spot. If we interpret the shorter (beginning: − 234 s) and longer (end: +213 s) periodicity in the frequency spectrum as a sign of differential rotation, then by using Pβ/Peq = 1 − αsin2β (see e.g. Oláh et al. 2003), where Peq and Pβ are the rotational periods at the equator and at a latitude β, we get a minimal α = ΔΩ/Ω = 0.0074 differential rotation parameter by assuming β = 90°. This is less than one quarter of the differential rotation measured on the Sun (0.04–0.05 as given by Lanza et al. 2009b). A similar value (0.0071) was found for the exoplanet hosting star, CoRoT-Exo-2a (Lanza et al. 2009a). CoRoT-Exo-6a revealed a much higher (0.12 ± 0.02) value (Lanza et al. 2011). An anti-solar differential rotation (α = − 0.0026) was determined for UZ Lib for the first time from the light curve alone by Oláh et al. (2003), a result supported by Doppler images. Model calculations for τ Boo show that the equator-pole differential rotation is 0.15–0.18 (Catala et al. 2007). The low differential rotation of CoRoT 102781750 suggests that the spots are concentrated in a narrow belt. The right side peak (shorter period) at the beginning of the run can be attributed to a feature (spot) located closer to the faster rotating region of the star, either the equator in a solar-type case or the pole in an anti-solar type activity. The left side peak (longer period) at the end of the run is attributed to a new active region appearing in the slower rotating region compared to the highest concentration spotted area. A prograde and retrograde migration of the individual spots in the old and new active regions, respectively, or a differently oriented surface flow pattern would result a similar right-left side lobe structure. The local increase in the amplitude between CoRoT HJD 2880–2890 can be attributed to a larger area covered by star spots owing to the appearance of a new spotted region.
Since more observational facts fit the active star hypothesis, we conclude that CoRoT 102781750 is not a background RR Lyrae star but a rotationally modulated, active star. Our new ground-based photometry, with lower light variation than 0.01 mag, excludes RR Lyrae type variability because a stable RR Lyrae pulsation, even with a Blazhko modulation cannot disappear. However, it supports the active star hypothesis, as a variability caused by activity can decrease or disappear in the course of the evolution of the active regions.
5.2. Short-period pulsation
In the section devoted to the contamination issue (Sect. 3), we concluded that two candidates, an uncertainly red (E, K5V?) and a definitely blue star (D) are responsible for the light variation in the CoRoT blue channel. Taking the 7.172 c d-1 frequency into account, we only have two options. The short-period pulsation belongs to a high-amplitude Delta Scuti star (HADS) or to a β Cephei type pulsation. We do not know any late-type variable star that produces such a short periodicity (rotational modulation is also excluded). Since the late spectral type fits neither the HADS nor the β Cephei stars, there is a higher probability that the short-period pulsation is shown by the blue star.
The weak appearance of the first harmonic of the short-period pulsation at 14.34503 c d-1 with a φ21 = 3.42 ± 0.3 rad phase value is in excellent agreement with what is expected for HADS (Poretti 2001). However, the Konkoly colour photometry suggests a very early spectral type compared to the mid spectral classes of the HADS type. In addition, the triplet can not be explained by rotational splitting in an HADS (radial mode). Therefore equally spaced, non-radial modes have to be supposed. The rotationally split non-radial mode in a β Cep type star is the most plausible explanation for the short-period pulsation.
5.2.1. Long-period variability
The long-period variability has the largest amplitude (0ṃ2) amongst the different kinds of variability presented here. Since in our interpretation the long-term variability is connected to a background star, it is worthwhile checking the amplitude of the intrinsic variability. The b channel is not contaminated by the whole flux of the main target, only by a fraction of the b channel total flux. According to the flux variation in Fig. 2, roughly 4–5000 flux units can be attributed to the background star in the b channel (roughly 1000 in g and there is no sign of the flux variation in r). Calculating the intrinsic amplitude dependence on the flux of the background star, we are faced with a 0.7 mag intrinsic variation. Usually a geometrical effect, the binarity can produce high variability. It is highly unlikely that the long-term variability belongs to the red star, since the short- and long-term variabilities seem to be connected, as the amplitude and phase modulation show. Both the short- and long-period variabilities belong to the same system or star.
According to the logical arguments there are two scenarios that may explain the observed variation. In the first one, we are faced with a binary system containing a β Cep type pulsating star. The system has to be synchronized since the rotational period (triplet spacing) and the orbital period are the same. However, the non-repetitive cycles and the long, constant minimum of the long-period variation do not support a binary system with a simple geometry.
In the second scenario, the short- and long-period variations are produced in a single star. The only possibility for a blue star is that we are faced with a β Cep/SPB hybrid pulsator in which a p mode (7.172 c d-1) and some g modes (0.067, 0.0777 and 0.0563 c d-1) are excited. The best example of a hybrid star detected before CoRoT is γ Peg (Chapellier et al. 2006). The p mode (6.01 c d-1) fits our case, but the g modes (0.68 and 0.87 c d-1) represent a much shorter periodicity than our long-period variability. The excitation of modes with a (high) radial order that fits the observed period is very unlikely. It would be a very improbable coincidence if an SPB star has exactly the same period as the rotational period of a β Cep star. Moreover, the light curve of the long-period variability does not look like an SPB light curve.
The periodic Be stars (λ Eri variables) show strictly periodic light variations, but with periods in the range of 0.5–2.0 days. The shortest period is found in HR 3858 (B6Ve, 6.7 h), twice as long as our detected periodicity (Balona 1995). The review paper by Porter & Rivius (2003) confirms the period range. These stars appear to have very active photospheres and outbursts in which the brightness can increase or decrease by several tenths of a magnitude. The regularity of the long-period variability with such a long constant minimum and the modulation of the short-period variation can hardly be explained by outbursts.
Thus, no definite conclusion can be made with the information at hand. However, we know the rotational period of the blue star given directly by the rotational splitting, e.g. 14.83 days. The luminosity variation with a 14.83-day periodicity must be something that rotates with the star. We have excluded the synchronized companion, but a hybrid solution can be constructed. A non-radially pulsating β Cep star (rotational splitting is possible) surrounded by a corotating dust disk can explain the similarity of the modulation of the short period and the orbital period. Higher density clumps in the disk orbiting at different distances from the star explain the periodicity at 14.83, 12.87, and 17.74 days. Maybe the instability of the modulation can also be explained by the non-homogeneous density distribution of the corotating disk. The disk is not in the equatorial plane, but it has some inclination. The pulsating star is covered by the dust disk for a different time period from cycle to cycle. The life time < 10 Myr of a young β Cep star does not exclude the existence of a dust disk around it, like in the Herbig Ae/Be stars. A fading by the circumstellar material with 0.7 mag is not unusual. However, a circumstellar disk would produce an infrared excess that we did not find in the 2MASS catalogue.
If the star E, which has an uncertain red spectral type and an unusual appearance in its colours, is really an early-type star (β Pictoris or UXOR) surrounded by circumstellar material, this would provide an explanation for the red colour. However, the short-term periodicity would have to be explained in a satisfying way.
Our ground-based observation did not show any variation in the stars D and E. However, the low amplitude, short-period variation has not been expected to be observable in such a faint star. The light variation of the long term variability has a 3 to 4 day long part that is constant at minimum and a slightly decreasing part around maximum. Two nights of observation over three nights did not contradict our hypothesis.
A separate and detailed observation of the candidates, ideally with spectroscopy (a great challenge due to the targets’ faintness), will help to solve this puzzle.
6. Conclusions
We conclude that CoRoT 102781750 is a spotted star with an 8.8-h average rotational period. A dP/dt = 1.6 × 10⁻⁶ period decrease was derived from the evolution of the spotted region. A differential rotation of α = 0.0074 is measured. An alternate (shorter or longer) second periodicity was interpreted as an independent spot or a new active region at the faster or slower rotating part of the star, respectively. The 0ṃ015 decrease in the light variation is due to the decay of the spots, while the local 0ṃ005 increase is a sign of a higher covered area due to the appearance of a new spotted region.
The CoRoT mask contains flux coming from a background star. Short-term variability (7.172 c d-1) and a long-term variability (14.83 d) are well-established facts. We argue for a β Cep pulsation against HADS and against a simple eclipsing binary system, a hybrid β Cep/SPB star and a Be star. The hypothetical solution we propose is either a β Cep star surrounded by a corotating dust disk inclined to the equatorial plane or a β Pictoris or UXOR star with a regular short-period variability.
These findings make these observations of CoRoT 102781750 an interesting astrophysical laboratory. Our investigation shows the potential of the CoRoT contaminated light curves and colours.
Further investigation of this star with large telescopes is highly recommended, as it will serve the interest of multiple fields of astronomy: active stars, asteroseismology, binary systems, or stellar formation.
Acknowledgments
M.P., J.M.B., and R.Sz. acknowledge the support of the ESA PECS projects No. 98022 & 98114 and the Hungarian OTKA grant K83790. M.P. thanks to B. Szeidl, K. Oláh, K. Vida, P. Ábrahám and A. Moór for fruitful discussions. K.K. and E.G. are supported by the Austrian FWF (Fonds zur Förderung der wissenschaftlichen Forschung) projects T359 and P19962, respectively. This research has made use of the Exo-Dat database, operated at LAM-OAMP, Marseille, France, on behalf of the CoRoT/Exoplanet programme.
References
- Alcock, C., Allsman, R., Alves, D. R., et al. 2000, ApJ, 542, 257 [NASA ADS] [CrossRef] [Google Scholar]
- Alcock, C., Alves, D. R., Becker, A., et al. 2003, ApJ, 598, 597 [NASA ADS] [CrossRef] [Google Scholar]
- Appourchaux, T., Samadi, R., & Dupret, M. A. 2009, A&A, 506, 1 [NASA ADS] [CrossRef] [EDP Sciences] [Google Scholar]
- Auvergne, M., Bodin, P., Boisnard, L., et al. 2009, A&A, 506, 411 [NASA ADS] [CrossRef] [EDP Sciences] [Google Scholar]
- Baglin, A., Vauclair, G., The CoRoT Team 2000, J. Astrophys. Astron., 21, 319 [Google Scholar]
- Baglin, A., Auvergne, M., Barge, P., et al. 2006, in The CoRoT Mission, Pre-Launch Status, Stellar Seismology and Planet Finding, ed. M. Fridlund, A. Baglin, J. Lochard, & L. Conroy (Nordwijk, Netherlands: ESA Publications Division), ESA SP-1036, 33 [Google Scholar]
- Balona, L. A. 1995, MNRAS, 277, 1547 [NASA ADS] [Google Scholar]
- Barge, P., Léger, A., Ollivier, M., et al. 2006, in The CoRoT Mission Pre-Launch Status – Stellar Seismology and Planet Finding, ed. M. Fridlund, A. Baglin, J. Lochard, & L. Conroy, ESA SP-1306, 83 [Google Scholar]
- Barge, P., Baglin, A., Auvergne, M., et al. 2008, in Exoplanets: Detection, Formation and Dynamics, Proc. IAU Symp., 249, 3 [NASA ADS] [Google Scholar]
- Benomar, A., Appourchaux, T., & Baduin, F. 2009, A&A, 506, 15 [NASA ADS] [CrossRef] [EDP Sciences] [Google Scholar]
- Bessel, M. S., & Brett, J. M. 1988, PASP, 100, 1134 [NASA ADS] [CrossRef] [Google Scholar]
- Breger, M., & Pamyatnykh, A.A. 2006, MNRAS, 368, 571 [NASA ADS] [CrossRef] [Google Scholar]
- Breger, M., Stich, J., Garrido, R., et al. 1993, A&A, 271, 482 [NASA ADS] [Google Scholar]
- Catala, C., Donati, J.-F., Shkolnik, E., et al. 2007, MNRAS, 374, L42 [NASA ADS] [Google Scholar]
- Chadid, M., Baglin, A., Benkő, J. M., et al. 2009, in Stellar Pulsation: Challanges for Theory and Observation, ed. J. A. Guzik, & P. Bradley, AIP Conf. Proc., 1170, 235 [Google Scholar]
- Chadid, M., Benkő, J. M., Szabó, R., et al. 2010, A&A, 510, A39 [NASA ADS] [CrossRef] [EDP Sciences] [Google Scholar]
- Chapellier, E., Le Contel, D., Le Contel, J. M., et al. 2006, A&A, 448, 697 [NASA ADS] [CrossRef] [EDP Sciences] [Google Scholar]
- Croll, B., Walker, G. A. H., Kuschnig, R., et al. 2006, ApJ, 648, 607 [NASA ADS] [CrossRef] [Google Scholar]
- Debosscher, J., Sarro, L. M., López, M., et al. 2009, A&A, 506, 519 [NASA ADS] [CrossRef] [EDP Sciences] [Google Scholar]
- Degroote, P., Briquet, M., Catala, C., et al. 2009, A&A, 506, 111 [NASA ADS] [CrossRef] [EDP Sciences] [Google Scholar]
- Deleuil, M., Meunier, J. C., Moutou, C., et al. 2009, AJ, 138, 649 [NASA ADS] [CrossRef] [Google Scholar]
- Diago, P. D., Gutiérrez-Soto, J., Auvergne, M., et al. 2009, A&A, 506, 125 [NASA ADS] [CrossRef] [EDP Sciences] [Google Scholar]
- Donati, J-F., Forveille, T, Collier Cameron, A., et al. 2006, Science, 311, 633 [NASA ADS] [CrossRef] [PubMed] [Google Scholar]
- Garcia, R. A., Régulo, C., Samadi, R., et al. 2009, A&A, 506, 41 [NASA ADS] [CrossRef] [EDP Sciences] [Google Scholar]
- Guggenberger, E., & Kolenberg, K. 2006, CoAst, 148, 21 [Google Scholar]
- Guggenberger, E., Kolenberg, K., Chapellier, E., et al. 2011, MNRAS, accepted [arXiv:1104.1726] [Google Scholar]
- Guinan, E. F., Güdel, M., Kang, Y. W., et al. 1997, in Variable Stars and the Astrophysical Returns of Microlensing Surveys, ed. R. Ferlet, J. P. Maillard, & B. Raban (Edition Frontiers), 339 [Google Scholar]
- Huat, A.-L., Hubert, A.-M., Baudin, F., et al. 2009, A&A, 506, 95 [NASA ADS] [CrossRef] [EDP Sciences] [Google Scholar]
- Jurcsik, J., Sódor, Á., Váradi, M., et al. 2005a, A&A, 430, 1049 [NASA ADS] [CrossRef] [EDP Sciences] [Google Scholar]
- Jurcsik, J., Szeidl, B., Nagy, A., et al. 2005b, Acta Astron., 55, 303 [Google Scholar]
- Jurcsik, J., Szeidl, B., Sódor, Á., et al. 2006, AJ, 132, 61 [NASA ADS] [CrossRef] [Google Scholar]
- Kallinger, T., Reegen, P., & Weiss, W. W. 2008, A&A, 481, 571 [NASA ADS] [CrossRef] [EDP Sciences] [Google Scholar]
- Kolenberg, K., Smith, H. A., Gazeas, K.D., et al. 2006, A&A, 459, 577 [Google Scholar]
- Kolenberg, K., Guggenberger, E., Medupe, T., et al. 2009, MNRAS, 396, 263 [NASA ADS] [CrossRef] [Google Scholar]
- Kolláth, Z., 1990, Occ. Tech. Notes Konkoly Obs., Budapest, No. 1 [Google Scholar]
- Lanza, A. F., Pagano, I., Leto, G., et al. 2009a, A&A, 493, 193 [NASA ADS] [CrossRef] [EDP Sciences] [Google Scholar]
- Lanza, A. F., Aigrain, S., Messina, S., et al. 2009b, A&A, 506, 255 [NASA ADS] [CrossRef] [EDP Sciences] [Google Scholar]
- Lanza, A. F., Bonomo, A. S., Moutou, C., et al. 2010, A&A, 520, A53 [NASA ADS] [CrossRef] [EDP Sciences] [Google Scholar]
- Lanza, A. F., Bonomo, A. S., Pagano, L., et al. 2011, A&A, 525, A14 [NASA ADS] [CrossRef] [EDP Sciences] [Google Scholar]
- Le Borgne, J. F., Paschke, A., Vandenbroere, J., et al. 2007, A&A, 476, 307 [NASA ADS] [CrossRef] [EDP Sciences] [Google Scholar]
- Léger, A., Rouan, D., Schneider, J., & Barge, P. 2006, in The CoRoT Mission Pre-Launch Status – Stellar Seismology and Planet Finding, ed. M. Fridlund, A. Baglin, J. Lochard, & L. Conroy, ESA SP-1306, 527 [Google Scholar]
- Léger, A., Rouan, D., Schneider, J., et al. 2009, A&A, 506, 287 [NASA ADS] [CrossRef] [EDP Sciences] [MathSciNet] [Google Scholar]
- Lenz, P., & Breger, M. 2005, CoAst., 146, 53 [Google Scholar]
- Monet, D. G., Levine, S. E., Canzian, B., et al. 2003, AJ, 125, 984 [NASA ADS] [CrossRef] [Google Scholar]
- Moskalik, P., & Poretti, E. 2003, A&A, 398, 213 [NASA ADS] [CrossRef] [EDP Sciences] [Google Scholar]
- Nagy, A. 1998, A&A, 339, 440 [NASA ADS] [Google Scholar]
- Oláh, K., Jurcsik, J., & Strassmeier, K. G. 2003, A&A, 410, 685 [NASA ADS] [CrossRef] [EDP Sciences] [Google Scholar]
- Paparó, M., Szabó, R., Benkő, J. M., et al. 2009, in Stellar Pulsation: Challanges for Theory and Observation, ed. J. A. Guzik, & P. Bradley, AIP Conf. Proc. 1170, 240 [Google Scholar]
- Pojmanski, G. 2002, Acta Astron., 52, 397 (ASAS catalogue) [NASA ADS] [Google Scholar]
- Poretti, E. 2001, A&A, 371, 986 [NASA ADS] [CrossRef] [EDP Sciences] [Google Scholar]
- Poretti, E., Michel, E., Garrido, R., et al. 2009, A&A, 506, 85 [NASA ADS] [CrossRef] [EDP Sciences] [Google Scholar]
- Poretti, E., Paparó, M., Deleuil, M., et al. 2010, A&A, 520, A108 [NASA ADS] [CrossRef] [EDP Sciences] [Google Scholar]
- Porter, J. M., & Rivinius, T. 2003, PASP, 115, 1153 [NASA ADS] [CrossRef] [Google Scholar]
- Queloz, D., Bouchy, F., Moutou, C., et al. 2009, A&A, 506, 303 [NASA ADS] [CrossRef] [EDP Sciences] [Google Scholar]
- Rouan, D., Baglin, A., Barge, P., et al. 1999, Phys. Chem. Earth (C), 24, 567 [Google Scholar]
- Samadi, R., Fialho, F., Costa, J. E. S., et al. 2006, in The CoRoT Mission Pre-Launch Status – Stellar Seismology and Planet Finding, ed. M. Fridlund, A. Baglin, J. Lochard, & L. Conroy, ESA SP-1306, 317 [Google Scholar]
- Sarro, L. M., Debosscher, J., Aerts, C., et al. 2009, A&A, 506, 535 [NASA ADS] [CrossRef] [EDP Sciences] [Google Scholar]
- Sesar, B., Svilković, D., Ivezić, Ž., et al. 2006, AJ, 131, 2801 [NASA ADS] [CrossRef] [Google Scholar]
- Skrutskie, M. F., Cutri, R. M., Stiening, R., et al. 2006, AJ, 131, 1163 [NASA ADS] [CrossRef] [Google Scholar]
- Smith, H. A., Barnett, H., Silbermann, N. A., & Gay, P. 1999, AJ, 118, 572 [NASA ADS] [CrossRef] [Google Scholar]
- Strassmeier, K. G. 2009, A&ARv, 17, 251 [NASA ADS] [CrossRef] [Google Scholar]
- Walker, G. A. H., Matthews, J., Kuschnig, R., et al. 2003, PASP, 115, 1023 [NASA ADS] [CrossRef] [Google Scholar]
- Walker, G. A. H., Croll, B., Kuschnig, R., et al. 2007, ApJ, 659, 1611 [NASA ADS] [CrossRef] [Google Scholar]
- Weiss, W. W., Aerts, C., Aigrain, S., et al. 2004, in Second Eddington Workshop: Stellar structure and habitable planet finding, ed. F. Favata, S. Aigrain, & A. Wilson, ESA SP-538, 435 [Google Scholar]
- Woźniak, P. R., Udalski, A., Szymański, M., et al. 2002, Acta Astron., 52, 129 [NASA ADS] [Google Scholar]
All Tables
Fitting parameters of the amplitude and phase modulation curves, presenting a new detailed approach to describing the triplet structure.
All Figures
|
Fig. 1 Distribution of non-zero flag measurements in the raw data of CoRoT 102781750: energetic particles (1), crossing of SAA (4 and 32), Earth eclipse inward (8) or outward (16), and their combinations. After removal, 70.2% of the original measurements were analysed. |
| In the text | |
|
Fig. 2 Zero-flag flux curves for the different colours. White flux was kept constant. The trends in the colour curves are the redistribution of flux over the colour borders due to the depointing fluctuations of the satellite. |
| In the text | |
|
Fig. 3 Map of the possibly contaminating stars, CoRoT 102781750 (upper left), CoRoT 102780084 (upper right) as seen by the CoRoT satellite. (Position of stars contained in the Exo-Dat database and USNO-A2 catalogue are marked by plus signs “+” and crosses “ × ”, respectively). The closer neighbourhoods of CoRoT 102781750 in DSS (lower left) and Konkoly observation (lower right) are shown. The star CoRoT 102781750 is marked by A in each panel. Data of the stars labelled by A-F are given in Table 1. |
| In the text | |
|
Fig. 4 Light curve in the r colour folded with the main pulsation period separately for the beginning (left) and the end (right) of the observing run. Continuous and dashed lines show the first and last cycles of the subset. |
| In the text | |
|
Fig. 5 Frequency solution for five subsets and the whole data for the main frequency (left) and for its harmonic (right). The harmonic shows a constant amplitude, while the dominant mode’s amplitude is obviously decreasing. |
| In the text | |
|
Fig. 6 Phase behaviour of the main frequency and its harmonic for five subsets and for the whole run. The main frequency’s phase reveals a sharp drop at the end of the run. |
| In the text | |
|
Fig. 7 Folded residual light curves after prewhitening with 2 (upper panel) or 12 frequencies (bottom panel). The final residual scatter agrees with the predicted value for a CoRoT target of similar brightness. |
| In the text | |
|
Fig. 8 Fine-scale amplitude and phase behaviour of the main frequency (left) and its harmonic (right) obtained by Period04. The harmonic does not show amplitude and phase variation. A 0ṃ015 amplitude decrease with a 0ṃ005 local increase are shown in the main periodicity. The straight increase in the phase of f0 is equivalent to the phase difference between the main frequency and its harmonic. |
| In the text | |
|
Fig. 9 Long-term modulation in the amplitude and phase of f1. Both time scales belong to the same star/stellar system. |
| In the text | |
|
Fig. 10 Long-term variability in b colour without the pulsation. Consecutive cycles are not repetitive. The most remarkable feature is the unevenly long, flat part of the cycles. |
| In the text | |
Current usage metrics show cumulative count of Article Views (full-text article views including HTML views, PDF and ePub downloads, according to the available data) and Abstracts Views on Vision4Press platform.
Data correspond to usage on the plateform after 2015. The current usage metrics is available 48-96 hours after online publication and is updated daily on week days.
Initial download of the metrics may take a while.