Free Access
Fig. 2
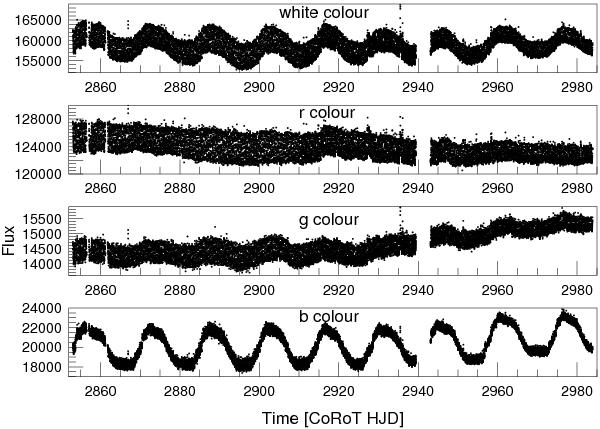
Zero-flag flux curves for the different colours. White flux was kept constant. The trends in the colour curves are the redistribution of flux over the colour borders due to the depointing fluctuations of the satellite.
Current usage metrics show cumulative count of Article Views (full-text article views including HTML views, PDF and ePub downloads, according to the available data) and Abstracts Views on Vision4Press platform.
Data correspond to usage on the plateform after 2015. The current usage metrics is available 48-96 hours after online publication and is updated daily on week days.
Initial download of the metrics may take a while.