Free Access
Fig. 4
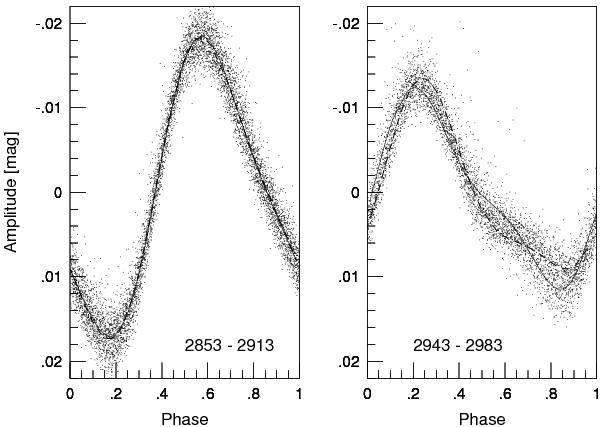
Light curve in the r colour folded with the main pulsation period separately for the beginning (left) and the end (right) of the observing run. Continuous and dashed lines show the first and last cycles of the subset.
Current usage metrics show cumulative count of Article Views (full-text article views including HTML views, PDF and ePub downloads, according to the available data) and Abstracts Views on Vision4Press platform.
Data correspond to usage on the plateform after 2015. The current usage metrics is available 48-96 hours after online publication and is updated daily on week days.
Initial download of the metrics may take a while.