Fig. 5
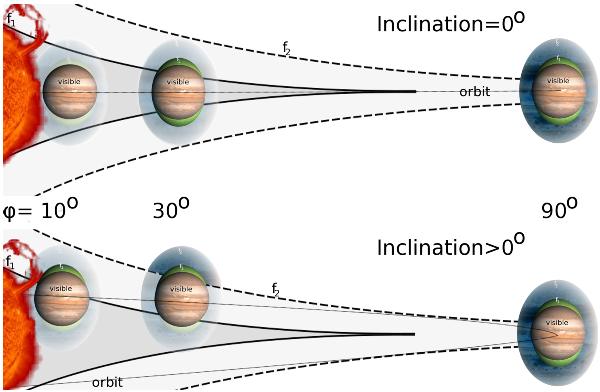
Sketch of the variation in the low frequency cutoff with the phase φ and the inclination i. The apparent sizes of the star (including its stellar wind) and the planet increase as the observed frequency decreases. Hence, the closer to the star the planet appears in projection on the plane of the the sky, the higher is the cutoff frequency. The gray zones delimited by the continuous and dashed lines corresponds to the regions where the solar wind plasma frequencies are higher than two frequencies f1 and f2 < f1, respectively. The green and blue regions surrounding the exoplanet are the apparent diameter of the planet (emission region) at the frequencies f1 and f2. The upper panel shows the case of a 0° inclination. In this case, as the planet apparent position is closer to the star, the radio emission from the planet becomes shielded, at low frequency first. This shielding occurs at a slower rate for larger inclinations of the planet orbit (lower panel). Note that this sketch is not to scale, the size of the star being much larger than that of the planet.
Current usage metrics show cumulative count of Article Views (full-text article views including HTML views, PDF and ePub downloads, according to the available data) and Abstracts Views on Vision4Press platform.
Data correspond to usage on the plateform after 2015. The current usage metrics is available 48-96 hours after online publication and is updated daily on week days.
Initial download of the metrics may take a while.