| Issue |
A&A
Volume 531, July 2011
|
|
|---|---|---|
| Article Number | A94 | |
| Number of page(s) | 7 | |
| Section | Stellar structure and evolution | |
| DOI | https://doi.org/10.1051/0004-6361/201016325 | |
| Published online | 21 June 2011 | |
The correlation between C/O ratio, metallicity, and the initial WD mass for SNe Ia⋆
1
School of Physics and Chemistry, Henan Polytechnic University,
Jiaozuo
454000,
PR China
e-mail: This email address is being protected from spambots. You need JavaScript enabled to view it.
2
Department of Astronomy, Beijing Normal University,
Beijing
100875, PR
China
Received:
15
December
2010
Accepted:
12
May
2011
Abstract
Context. When type Ia supernovae (SNe Ia) were chosen as distance indicators to measure cosmological parameters, the Phillips relation was applied. However, the origin of the scatter in the maximum luminosity of SNe Ia (or the variation in the production of 56Ni) remains unclear. Both the metallicity in general and the carbon abundance of a white dwarf (WD) before a supernova explosion are important parameters, but neither has the ability to interpret the scatter in the maximum luminosity of SNe Ia.
Aims. We attempt to check whether or not the carbon abundance can be affected by initial metallicity.
Methods. We calculated a series of stellar evolution models with various masses and metallicities.
Results. We found that when Z ≤ 0.02, the carbon abundance is almost independent of metallicity if it is plotted against the initial WD mass. However, when Z > 0.02, the carbon abundance is not only a function of the initial WD mass, but also metallicity, i.e. for a given initial WD mass, the higher the metallicity, the lower the carbon abundance. On the basis of some previous studies, i.e. which find that both a high metallicity and a low carbon abundance lead to a lower production of 56Ni being formed during a SN Ia explosion, the effects of the carbon abundance and the metallicity on the amount of 56Ni are enhanced by each other, which may account, at least qualitatively, for the variation in the maximum luminosity of SNe Ia.
Conclusions. Since the central density of WD before a supernova explosion may also play a role in the production of 56Ni and the parameters (the carbon abundance, the metallicity, and the central density) are all determined by the initial parameters of the progenitor system, i.e. the initial WD mass, metallicity, orbital period and secondary mass, the amount of 56Ni might be a function of the initial parameters. Then, our results might construct a bridge linking the progenitor model to the explosion model of SNe Ia.
Key words: white dwarfs / supernovae: general
Appendix is available in electronic form at http://www.aanda.org
© ESO, 2011
1. Introduction
As principal distance indicators, type Ia supernovae (SNe Ia) can provide important constraints in determining cosmological parameters, which resulted in the discovery of the accelerating expansion of the universe (Riess et al. 1998; Perlmutter et al. 1999). The result was exciting and suggested the presence of dark energy. At present, SNe Ia are regarded as critical cosmological probes for testing both the evolution of the dark energy equation of state with time and the evolutionary history of the universe (Riess et al. 2007; Kuznetsova et al. 2008; Howell et al. 2009a).
When SNe Ia are applied as a distance indicator, the Phillips relation is adopted, which is a linear relation between the absolute magnitude of SNe Ia at maximum light and the magnitude drop in the B light curve during the first 15 days following the maximum (Phillips 1993). This relation was motivated by the observations of two peculiar events, i.e. SN 1991bg and SN 1991T, and implies that the brightness of SNe Ia is mainly determined by one parameter. There is a consensus that a SN Ia is produced by a thermonuclear explosion of a carbon-oxygen white dwarf (CO WD) and the amount of 56Ni formed during the supernova explosion dominates the maximum luminosity of SNe Ia (Arnett 1982). However, the origin of the variation in the amount of 56Ni for different SNe Ia is still unclear (Podsiadlowski et al. 2008). Many efforts have been made to resolve this problem. Some multi-dimensional numerical simulations have shown that the ignition intensity (the number of ignition points) at the center of WDs or the transition density from deflagration to detonation are wonderful parameters for interpreting the Phillips relation (Hillebrandt & Niemeyer 2000; Höflich et al. 2006; 2010; Kasen et al. 2010). In addition, the ratio of nuclear-statistical-equilibrium (NES) to intermediate-mass elements (IME) in the explosion ejecta is likely to be the key parameter for the width of SN Ia light curve and its peak luminosity (Pinto & Eastman 2001; Mazzali et al. 2001; 2007). For the simulations above, a reasonable assumption is that these parameters are determined by one or some properties of SNe Ia progenitors. Since these parameters are allowed to vary in the numerical simulations of SNe Ia explosions, the question has become which property or properties of progenitor system determine these parameters, one that remains unclear. Lesaffre et al. (2006) carried out a systematic study of the sensitivity of ignition conditions for H-rich Chandra single degenerate exploders to various properties of the progenitors, and suggested that the central density of the WD at ignition may be the origin of the Phillips relation (see also Podsiadlowski et al. 2008). This suggestion was upheld by detailed multi-dimensional numerical simulations of explosion (Krueger et al. 2010). However, in the models of Höflich et al. (2010), the central density is only a second parameter, and the cooling time of the WDs before mass transfer in Lesaffre et al. (2006) and Krueger et al. (2010) is shorter than 1 Gyr. However, there are SNe Ia as old as 10 Gyr. The WDs with such a long cooling time may become more degenerate before the onset of accretion phase. Some other processes such as C and O separation or crystallization may occur, and dominate the properties of the CO WD (Fontaine et al. 2001). How the extremely degenerate conditions affect the properties of SNe Ia remains unclear. The suggestion of Lesaffre et al. (2006) should then be checked carefully under extremely degenerate conditions (Bravo et al. 2011). Some numerical and synthetical studies have shown that metallicity has an effect on the final amount of 56Ni, and thus the maximum luminosity (Timmes et al. 2003; Travaglio et al. 2005; Podsiadlowski et al. 2006; Bravo et al. 2010) and that some observational evidence does exist of the correlation between the properties of SNe Ia and metallicity (Branch & Bergh 1993; Hamuy et al. 1996; Wang et al. 1997; Cappellaro et al. 1997; Shanks et al. 2002). However, the metallicity dose not seem to have the ability to interpret the whole scatter in the maximum luminosity of SNe Ia (Timmes et al. 2003; Gallagher et al. 2008; Howell et al. 2009b).
Nomoto et al. (1999; 2003) suggested that the average1 ratio of carbon to oxygen (C/O) of a white dwarf at the moment of explosion is the dominant parameter of the Phillips relation (see also Umeda et al. 1999b). The higher the C/O, the larger the amount of nickel-56, and then the higher the maximum luminosity of SNe Ia. By comparing theory and observations, the results of Meng et al. (2009) and Meng & Yang (2010a) upheld this suggestion. Nomoto et al. (1999; 2003) used a total 12C mass fraction included in the convective core of mass M = 1.14 M⊙ just before the SN Ia explosion, X(c), to represent the C/O ratio. Their suggestion is based on the dependence of X(c) on metallicity being small when it is plotted against the initial mass of WDs when Z ≤ 0.02. When Z ≤ 0.02, the effect of metallicity on the amount of 56Ni can be neglected. Only when Z > 0.02, does metallicity have a significant influence on the production of 56Ni in SNe Ia explosions (Timmes et al. 2003). Here, we wish to verify whether the C/O ratio remains unaffected by metallicity when Z > 0.02.
In Sect. 2, we simply describe our method, and present the calculation results in Sect. 3. In Sect. 4, we show discussions and our main conclusions.
2. Method
Our work presented here is based on the single degenerate scenario, i.e. that a SN Ia originates from a CO WD in a binary system and that its companion is a main sequence or a slightly evolved star (WD+MS), a red giant star (WD+RG) or a helium star (WD + He star) (Whelan & Iben 1973; Nomoto et al. 1984). This scenario has been widely studied by many groups (Li & van den Heuvel 1997; Hachisu et al. 1999a; Langer et al. 2000; Han & Podsiadlowski 2004; Chen & Li 2007; Hachisu et al. 2008; Meng et al. 2009; Lü et al. 2009; Wang et al. 2009a,b; Meng & Yang 2010b,c; Wang et al. 2010). We assume that an initial CO WD is derived from a main sequence (MS) star in a primordial binary system (primary). The CO WD accretes hydrogen-rich material from its companion via a Roche lobe overflow or wind, where the companion is a normal star. The accreted hydrogen-rich material is burned into helium, and then the helium is converted to both carbon and oxygen. The CO WD increases its mass until the mass reaches 1.378 M⊙ (close to the Chandrasekhar mass limit, Nomoto et al. 1984) where it explodes in a thermonuclear supernova. A binary system with the same primordial primary but different orbital period may produce a CO WD of different mass. For simplicity, we assume that if the MS mass of the primary in a primordial binary system is the same, the initial mass of the CO WD from the binary system is the same and equal to the core mass derived from the envelope-ejection model in Han et al. (1994) and Meng et al. (2008) (see below in details). Because the primary in a binary system may lose its hydrogen envelope because of the influence of secondary before it fulfills the criterion for the envelope ejection, the initial mass of CO WD in this paper should be taken as an upper limit to the real case. This assumption cannot affect our results becuase we only wish to find a relation between the C/O ratio, the WD mass, and metallicity. The method used here is similar to that in Umeda et al. (1999a) and Höflich et al. (2010).
The C/O ratio before the SN Ia explosion is a result of both stellar and binary evolution, i.e. during central helium burning and thin shell burning during the stellar evolution and the accretion to close to the Chandrasekhar mass limit (1.378 M⊙, Nomoto et al. 1984). After the central helium burning phase, the C/O ratio is low, i.e. 0.25−0.5 depending on the initial mass and metallicity of a main sequence (MS) star (Umeda et al. 1999a). The C/O ratio obtained from the burning shell is ≈1, because the helium in the shell has a lower density and a higher temperature than helium burning in the core (Höflich et al. 2010).
In the paper, we calculated a series of stellar evolution models
with the primordial MS mass from 1 M⊙ to
6.5 M⊙ until the stars evolve to the asymptotic giant branch
(AGB) stage. When a star evolves to the stage, its envelope may be lost if the binding
energy (BE) of the envelope transforms from a negative phase to a positive one (Paczyński
& Ziólkowski 1968; see also Fig. 2 in Meng
et al. 2008). We calculated the BE of the envelope to
be  (1)where
Mc is the core mass, Ms is the
surface value of the mass coordinate m, and U is the
internal energy of thermodynamics where those due to ionization of H and dissociation of
H2, as well as the basic
(1)where
Mc is the core mass, Ms is the
surface value of the mass coordinate m, and U is the
internal energy of thermodynamics where those due to ionization of H and dissociation of
H2, as well as the basic  for a perfect gas are all
included. Here, we assume that a star will lose its envelope when the BE of the star’s
envelope increases to the point of ΔW = 0 and the core mass at the point is
the final WD mass. The method here is robust and its virtue is significant because we need
not consider the specific mechanism of mass loss since the mass loss rate is very
uncertainty (see Meng et al. 2008, in details about
this method). We assume that after envelope ejection the remnant is a CO WD if carbon and
oxygen have not been ignited at the moment of envelope ejection. Following shell burning, we
assume that the C/O ratio is 12 until
MWD = 1.378 M⊙ as did in Umeda
et al. (1999a) and Höflich et al. (2010).
for a perfect gas are all
included. Here, we assume that a star will lose its envelope when the BE of the star’s
envelope increases to the point of ΔW = 0 and the core mass at the point is
the final WD mass. The method here is robust and its virtue is significant because we need
not consider the specific mechanism of mass loss since the mass loss rate is very
uncertainty (see Meng et al. 2008, in details about
this method). We assume that after envelope ejection the remnant is a CO WD if carbon and
oxygen have not been ignited at the moment of envelope ejection. Following shell burning, we
assume that the C/O ratio is 12 until
MWD = 1.378 M⊙ as did in Umeda
et al. (1999a) and Höflich et al. (2010).
We use the stellar evolution code of
Eggleton (1971; 1972; 1973), which has been updated with
the latest input physics over the past three decades (Han et al. 1994; Pols et al. 1995; 1998). The chemistry of a WD is mainly determined by the
competition between two major nuclear reactions powering the He burning, i.e.
3α and 12C(α,γ)16O. As discussed
by Imbriani et al. (2001) and Prada Moroni &
Straniero (2002), the final C/O after the central
helium exhaustion not only depends on the rate of these two reactions, but also is
significantly influenced by the efficiency of the convective mixing operating at the central
helium burning phase. We set the ratio of mixing length to local pressure scale height,
α = l/Hp,
to 2.0, and set the convective overshooting parameter, δOV, to
0.12 (Pols et al. 1997; Schröder et al. 1997), which roughly corresponds to an overshooting
length of 0.25HP. The two parameters are adopted during the
whole evolution of star. For the occurrence of convective instability near the He exhaustion
in the central core, some breathing pulses are expected. (Castellani 1985; 1989). This phenomenon may
also occur naturally in our code. The reaction rates are from Caughlan & Fowler
(1988), except for the
12C(α,γ)16O reaction, which is taken from Caughlan
et al. (1985). The range of metallicity is from
0.0001 to 0.1, i.e. 0.0001, 0.0003, 0.001, 0.004, 0.01, 0.02, 0.03, 0.04, 0.05, 0.06, 0.08,
and 0.1. The opacity tables for these metallicties are compiled by Chen & Tout
(2007) from Iglesias & Rogers (1996) and Alexander & Ferguson (1994). For a given Z, the initial
hydrogen mass fraction is assumed to be  (2)(Pols et al. 1998), and then the helium mass fraction is
Y = 1 − X − Z = 0.24 + 2Z.
On the basis of the correlation between X, Y, and
Z used here, Pols et al. (1998)
accurately reproduced the color-magnitude diagrams (CMD) of some clusters.
(2)(Pols et al. 1998), and then the helium mass fraction is
Y = 1 − X − Z = 0.24 + 2Z.
On the basis of the correlation between X, Y, and
Z used here, Pols et al. (1998)
accurately reproduced the color-magnitude diagrams (CMD) of some clusters.
In this paper, we skip thermal pulses by taking a longer time-step to reduce the computing time, i.e. we study the average evolution of thermally pulsing AGB models. This treatment of the thermal pulses may miss some information about the structural change of the envelope due to the thermal pulse. However, these treatment will not affect our final results because the situation of ΔW = 0 is fulfilled before the onset of thermal pulse and after the point a simple assumption of C/O = 1 is adopted (see also in Meng et al. 2008).
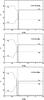 |
Fig. 1 Abundances of several elements in mass fraction in the inner core of three models with different primordial MS masses and different metallicities at the moment of envelope ejection. The solid, dotted, dashed and dot-dashed lines represent hydrogen, helium, carbon, and oxygen abundance, respectively. Top: Z = 0.001 and Mi = 3.51; middle: Z = 0.02 and Mi = 4.52; bottom: Z = 0.06 and Mi = 4.32. |
3. Results
In this paper, we use total carbon abundance to represent the C/O ratio and a core mass to represent the initial WD mass in a similar way to Umeda et al. (1999b). In Fig. 1, we show the abundances of several elements as a mass fraction in the inner core of three representative models with different metallicity at the moment of envelope ejection. In the figure, the H burning shell is located around the mass coordinate of m = 0.9 M⊙, which means that the remnants from the models have a similar mass, i.e. the initial WD mass from the stars is similar. An interesting feature in the figure is that the carbon abundance and the flat part of the carbon abundance profile in the inner core decrease with metallicity (Umeda et al. 1999a; Dominguez et al. 2001).The carbon abundance is mainly derived from the result of the competition between 3α and 12C(α,γ)16O reaction in the central helium burning phase, while the flat profile is the result of the central helium burning, which occurs in a convective core. An increase in the metallicity leads to an increase in the radiative opacity, and consequently, a decrease in the central temperature at a given phase, and a decrease in the He core mass at the 3α onset. For the central helium-burning phase, this leads to a smaller convective core, hence a smaller region characterized by a flat C/O profile. A low central temperature favors the destruction reaction of 12C, namely the 12C(α,γ)16O with respect the 3α reaction, which is the main cause of the decrease in the central carbon abundance. In addition, the central carbon abundance is also relevant to the helium abundance in the central helium-burning phase, and then to metallicity via Y = 1 − Z at the beginning of central helium burning. For a given temperature, a low helium abundance, i.e. a high metallicity, means slightly lower burning rates for the 3α reaction. However, between the model of Z = 0.001 and Z = 0.02 in Fig. 1, the difference in the carbon abundance is insignificant, but the difference between the models of Z = 0.02 and Z = 0.06 is remarkable. The effect of metallicity on the C/O ratio may then not be neglected when Z > 0.02. In addition, the hydrogen abundance decreases and helium abundance increases with metallicity in the figure, which is a natural result of Eq. (2)3.
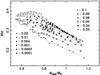 |
Fig. 2 The relation between the total carbon abundance of WDs before a supernova explosion and the initial WD mass for SNe Ia with different metallicities. The gray points represent those that might not contribute to SNe Ia. |
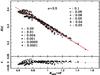 |
Fig. 3 The relation between the total carbon abundance of WDs beforea supernova explosion, the initial WD mass and metallicity. The solid line is the best-fit linear relation, where the line fits all the points shown in Fig. 2. The lower panel shows the difference between the points and the fitted line. |
In Fig. 24, we show the relation between the total carbon mass fraction of WDs before a SN Ia explosion and the initial WD mass for SNe Ia with different metallicities. For the cases of Z ≤ 0.02, the results here are similar to those in Nomoto et al. (1999; 2003), i.e. the relation between the carbon abundance and the initial WD mass is independent of metallicity, especially for MWD ≥ 0.8 M⊙. When MWD ≤ 0.8 M⊙, the scatter is enlarged for the cases of Z ≤ 0.02, which is mainly in the case of low-metallicity (≤0.001, see also Fig. 12 in Umeda et al. 1999a). However, for the low-metallicity cases, the WDs with a mass lower than 0.8 M⊙ may not contribute to SNe Ia (see Fig. 5 in Meng et al. 2009).
A remarkable feature in Fig. 2 is that when Z > 0.02, the relation between the carbon abundance and the initial WD mass deviates significantly from those of Z ≤ 0.02 and the deviation increases with metallicity, i.e. for a given initial WD mass, a high metallicity leads to a lower carbon abundance as shown in Fig. 1. This is similar to the result found by Timmes et al. (2003), i.e. only when Z > 0.02 does the influence of metallicity becomes significant. So, the discovery of Umeda et al. (1999b) and Nomoto et al. (1999; 2003) is a low-metallicity limit of the result found in this paper.
In the three-dimensional space of
(XC,Mcore,Z),
the relations between the carbon abundance and the initial WD mass with different
metallicity are almost in a plane. We take the XC as a function
of Mcore + αZ and use the minimum
χ2 method to find the best relation. We found that a linear
relation may well represent the relation when α = 3.5. The best-fit
relation is  (3)where
 .
We also try to use a parabola to fit the relation between XC and
Mcore + αZ, but the improvement is slight,
i.e.
.
We also try to use a parabola to fit the relation between XC and
Mcore + αZ, but the improvement is slight,
i.e.  .
As can be seen from Eq. (3), both a high
initial WD mass and a high initial metallicity lead to a lower carbon abundance. In
addition, if the metallicity is low enough, its effect on the carbon abundance can be
neglected. However, the effect of a high metallicity is significant. For example, for a
typical value of Mi = 0.8 M⊙
(Meng et al. 2009; Meng & Yang 2010a), the uncertainty in XC
derived for a metallicity of Z ≤ 0.02 is smaller than 5%, but may be as
large as 25% for Z > 0.02.
.
As can be seen from Eq. (3), both a high
initial WD mass and a high initial metallicity lead to a lower carbon abundance. In
addition, if the metallicity is low enough, its effect on the carbon abundance can be
neglected. However, the effect of a high metallicity is significant. For example, for a
typical value of Mi = 0.8 M⊙
(Meng et al. 2009; Meng & Yang 2010a), the uncertainty in XC
derived for a metallicity of Z ≤ 0.02 is smaller than 5%, but may be as
large as 25% for Z > 0.02.
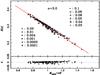 |
Fig. 4 The relation between the total carbon abundance of WDs before SNe Ia explosion, the initial WD mass and metallicity, where the points which may not contribute to SNe Ia are cut off. The solid line is the best-fit linear relation. The lower panel shows the difference between the points and the fitted line. |
If the points that might not
contribute to SNe Ia in Fig. 2 were removed, we may
even obtain a tighter linear relation, i.e.
XC = 0.5824 − 0.2862(Mcore + αZ)
where α = 3.0 and  (see Fig. 4).
4. Discussion and conclusions
When one simulates a SN Ia explosion, the carbon abundance (the C/O ratio) and metallicity are always treated as free parameters. However, neither of them has the ability to interpret the variation in the mass of 56Ni ejected by SNe Ia, especially for subluminous SNe Ia (such as 1991bg-like supernovae, Timmes et al. 2003; Röpke et al. 2006; Bravo et al. 2011). However, there is much evidence of a correlation between the maximum luminosity of SNe Ia and metallicity. For example, many groups have found that subluminous SNe Ia occur exclusively in massive galaxies (Neill et al. 2009; Sullivan et al. 2010; González-Gaitán et al. 2011; Lampeitl et al. 2010). When we consider the mass-metallicity relation of galaxies (Tremonti et al. 2004), this result implies that subluminous SNe Ia favor more metal-rich environments. In addition, some 1991T-like SNe Ia have been discovered in metal-poor environments5 (Prieto et al. 2008; Badenes et al. 2009; Khan et al. 2011). Hence, metallicity should play a more significant role across a rather wide range of its values than suggested by theory. The conflict between theory and observations should be resolved.
In this paper, we found that when Z > 0.02, the carbon abundance before SN Ia explosion is affected not only by the initial WD mass but also the metallicity. For a given initial WD mass, the higher the metallicity, the lower the carbon abundance. The relation between the carbon abundance, the initial WD mass, and the metallicity may be represented by a simple linear relation. Thus, when one simulates the SN Ia explosion, the carbon abundance (the C/O ratio) and metallicity should not be treated as free parameters. Both parameters have indeed an almost equivalent effect on the amount of 56Ni that is produced because both a high metallicity and a low carbon abundance can lead to a lower amount of 56Ni being produced (Nomoto et al. 1999; 2003; Timmes et al. 2003). Hence, our result may explain the variation in the maximum luminosity of SNe Ia, at least qualitatively providing a method to conquer the conflict stated above. However, we recall that it remains unclear whether the combined action of the C/O ratio and metallicity can explain the variation in the maximum luminosity of SNe Ia. Hence, we encourage further attempts to perform a detailed numerical simulation of this problem based on the results presents here.
Furthermore, the central density at the moment of supernova explosion may also play a role to some extent (Höflich et al. 2010; Krueger et al. 2010), and the carbon abundance, metallicity, and the central density might all contribute to the variation in the maximum luminosity of SNe Ia (Röpke et al. 2005). By making a simple assumption that the carbon abundance is a function of the initial WD mass and the central density is determined by an initial WD mass and its cooling time, Meng et al. (2010) found that WDs with high carbon abundances usually have a lower central density at ignition, while those with the highest central density at ignition generally have a lower carbon abundance. Interestingly, the effects of a high metallicity, a low C/O ratio, and a high central density on the amount of 56Ni are all similar, i.e. they produce a smaller amount of 56Ni and thus a dimmer event (Nomoto et al. 1999; 2003; Timmes et al. 2003; Krueger et al. 2010); hence all of them could explain why elliptical galaxies tend to contain dim SNe Ia (Hamuy 1996). Although it remains unclear how the metallicity affects the central density, we may hypothesize optimistically that it is unreasonable to consider the carbon abundance, metallicity, and the central density as free parameters when one simulates a SN Ia explosion, and these parameters may all contribute to the production of 56Ni (Röpke et al. 2005), hence help it explain the origin of the Phillips relation. Moreover, these parameters can be inferred from the initial parameters of a progenitor system, i.e. the WD mass, metallicity, orbital period, and secondary mass. For example, the C/O ratio is a function of the initial WD mass and metallicity, while the central density of a WD before a supernova explosion is determined from the accretion rate and its cooling time before the onset of mass transfer, which is related to the initial WD mass, secondary mass, and period. Our study might then provide a bridge linking the progenitor model to the explosion model of SNe Ia.
Online material
Appendix A: Some physical quantities for models
In this paper, we calculated a series of model with various masses and metallicities. Here, we provide some physical quantities of the models such as CO core mass, total carbon abundance X(C), initial main-sequence mass, and metallicity, which may be helpful for resolving open question in this research field. Here, the boundary of the CO core was located at 10% of the maximum helium abundance in the helium shell (see the left dotted line in Fig. 1).
CO core masses (in M⊙) for different metallicities (in Z⊙, Row 1) and different initial masses (Col. 1, in M⊙).
Total carbon mass fraction of WDs before SNe Ia explosion for different metallicities (in Z⊙, Row 1) and different initial masses (Col. 1, in M⊙).
If there is no special statement, the C/O ratio in this paper is the average value over the whole WD structure just before the SN explosion.
For the core chemical profile produced during the AGB phase, the steady increase in the carbon abundance in the region adjacent to the inner flat profile is synthesized by the shell in the early AGB, whereas the following abrupt peak is left by the thermally pulsing phase. The slope of the profile produced during the early AGB depends on both the initial mass and metallicity, and the C/O = 1 is not always a good approximation. However, to compare with previous results, we still simply make a constant-ratio assumption.
Here, the gray points are plotted based on the study in Meng et al. (2009). Please keep in mind that the results for the lower limit of WDs for SNe Ia in Meng et al. (2009) may be higher than that in Meng & Yang (2010a) since some special effects such as mass-stripping effect of an optically thick wind and the effect of thermal unstable disk are considered in Meng & Yang (2010a).
Even 2003fg-like SNe Ia, which are over-luminous events, tend to always be detected in metal-poor environments (Taubenberger et al. 2011), but the discussion about these SNe Ia is beyond the scope of this paper since these SNe Ia are over Chandrasekhar mass limit (Howell et al. 2006) and this paper is based on the Chandrasekhar mass model.
Acknowledgments
This work was partly supported by Natural Science Foundation of China under grant No. 11003003 and the Project of the Fundamental and Frontier Research of Henan Province under grant No. 102300410223, the Project of Science and Technology from the Ministry of Education (211102) and the China Postdoctoral Science Foundation funded project 20100480222.
References
- Alexander, D. R., & Ferguson, J. W. 1994, ApJ, 437, 879 [NASA ADS] [CrossRef] [Google Scholar]
- Arnett, W. D. 1982, ApJ, 253, 785 [NASA ADS] [CrossRef] [Google Scholar]
- Badenes, C., Harris, J., Zaritsky, D., et al. 2009, ApJ, 700, 727 [NASA ADS] [CrossRef] [Google Scholar]
- Branch, D., & Bergh, S. V. 1993, AJ, 105, 2231 [NASA ADS] [CrossRef] [Google Scholar]
- Bravo, E., Domínguez, I., Badenes, C., et al. 2010, ApJ, 711, L66 [NASA ADS] [CrossRef] [Google Scholar]
- Bravo, E., Althaus, L. G., García-Berro, E., et al. 2011, A&A, 526, A26 [NASA ADS] [CrossRef] [EDP Sciences] [Google Scholar]
- Busso, M., Gallino, R., & Wasserburg, G. J. 1999, ARA&A, 37, 239 [NASA ADS] [CrossRef] [Google Scholar]
- Cappellaro, E., Turatto, M., Tsvetkov, D. Y., et al. 1997, A&A, 322, 431 [NASA ADS] [Google Scholar]
- Castellani, V., Chieffi, A., Tornambe, A., & Pulone, L. 1985, ApJ, 296, 204 [NASA ADS] [CrossRef] [Google Scholar]
- Castellani, V., Chieffi, A., & Pulone, L. 1989, ApJ, 344, 239 [NASA ADS] [CrossRef] [Google Scholar]
- Caughlan, G. R., & Fowler, W. A. 1988, At. Data Nucl. Data Tables, 40, 284 [Google Scholar]
- Caughlan, G. R., Fowler, W. A., Harris, M. J., & Zimmerman, B. A. 1985, At. Data Nucl. Data Tables, 35, 198 [Google Scholar]
- Chen, W., & Li, X. 2007, ApJ, 658, L51 [NASA ADS] [CrossRef] [Google Scholar]
- Chen, X., & Tout, C. A. 2007, ChJAA, 7, 245 [Google Scholar]
- Dominguez, I., Höflich, P., & Straniero, O. 2001, ApJ, 557, 279 [NASA ADS] [CrossRef] [Google Scholar]
- Eggleton, P. P. 1971, MNRAS, 151, 351 [NASA ADS] [CrossRef] [Google Scholar]
- Eggleton, P. P. 1972, MNRAS, 156, 361 [NASA ADS] [Google Scholar]
- Eggleton, P. P. 1973, MNRAS, 163, 279 [NASA ADS] [CrossRef] [Google Scholar]
- Fontaine, G., Brassard, P., & Bergeron, P. 2001, PASP, 113, 409 [NASA ADS] [CrossRef] [Google Scholar]
- Gallagher, J. S., Garnavich, P. M., Caldwell, N., et al. 2008, ApJ, 685, 752 [NASA ADS] [CrossRef] [Google Scholar]
- González-Gaitán, S., Perrett, K., Sullivan, M., et al. 2011, ApJ, 727, 107 [NASA ADS] [CrossRef] [Google Scholar]
- Hachisu, I., Kato, M., Nomoto, K., et al. 1999, ApJ, 519, 314 [NASA ADS] [CrossRef] [Google Scholar]
- Hachisu, I., Kato, M., & Nomoto, K. 2008, ApJ, 679, 1390 [Google Scholar]
- Hamuy, M., Phillips, M. M., Schommer, R. A., et al. 1996, AJ, 112, 2391 [NASA ADS] [CrossRef] [Google Scholar]
- Han, Z., & Podsiadlowski, Ph. 2004, MNRAS, 350, 1301 [NASA ADS] [CrossRef] [Google Scholar]
- Han, Z., Podsiadlowski, P., & Eggleton, P. P. 1994, MNRAS, 270, 121 [NASA ADS] [CrossRef] [Google Scholar]
- Hillebrandt, W., & Niemeyer, J. C. 2000, ARA&A, 38, 191 [NASA ADS] [CrossRef] [Google Scholar]
- Höflich, P., Gerardy, C. L., Marion, H., & Quimby, R. 2006, NewAR, 50, 470 [Google Scholar]
- Höflich, P., Krisciunas, K., Khokhlov, A. M., et al. 2010, ApJ, 710, 444 [NASA ADS] [CrossRef] [Google Scholar]
- Howell, D. A., Sullivan, M., Nugent, P. E., et al. 2006, Nature, 443, 308 [NASA ADS] [CrossRef] [PubMed] [Google Scholar]
- Howell, D. A., Conley, A., Della Valle, M., et al. 2009a [arXiv:0903.1086] [Google Scholar]
- Howell, D. A., Sullivan, M., Brown, E. F., et al. 2009b, ApJ, 691, 661 [NASA ADS] [CrossRef] [Google Scholar]
- Iglesias, C. A., & Rogers, F. J. 1996, ApJ, 464, 943 [NASA ADS] [CrossRef] [Google Scholar]
- Imbriani, G., Limongi, M., Gialanella, L., et al. 2001, ApJ, 558, 903 [NASA ADS] [CrossRef] [Google Scholar]
- Kasen, D., Röpke, F. K., & Woosley, S. E. 2010, Nature, 460, 869 [Google Scholar]
- Khan, R., Stanek, K. Z., Prieto, J. L., et al. 2011, ApJ, 726, 106 [NASA ADS] [CrossRef] [Google Scholar]
- Krueger, B. K., Jackson, A. P., Townsley, D. M., et al. 2010, ApJ, 719, L5 [NASA ADS] [CrossRef] [Google Scholar]
- Kuznetsova, N., Barbary, K., Connolly, B., et al. 2008, ApJ, 673, 981 [NASA ADS] [CrossRef] [Google Scholar]
- Lampeitl, H., Smith, M., Nichol, R. C., et al. 2010, ApJ, 722, 565 [Google Scholar]
- Langer, N., Deutschmann, A., Wellstein, S., et al. 2000, A&A, 362, 1046 [NASA ADS] [Google Scholar]
- Lesaffre, P., Han, Z., Tout, C. A., et al. 2006, MNRAS, 368, 187 [NASA ADS] [CrossRef] [Google Scholar]
- Li, X. D., & van den Heuvel, E. P. J. 1997, A&A, 322, L9 [NASA ADS] [Google Scholar]
- Lü, G., Zhu, C., Wang, Z., & Wang, N. 2009, MNRAS, 396, 1086 [NASA ADS] [CrossRef] [Google Scholar]
- Mazzali, P. A., Nomoto, K., Cappellaro, E., et al. 2001, ApJ, 547, 988 [NASA ADS] [CrossRef] [Google Scholar]
- Mazzali, P. A., Röpke, F. K., Benetti, S., & Hillebrandt, W. 2007, Science, 315, 825 [NASA ADS] [CrossRef] [PubMed] [Google Scholar]
- Meng, X., Chen, X., & Han, Z. 2008, A&A, 487, 625 [NASA ADS] [CrossRef] [EDP Sciences] [Google Scholar]
- Meng, X., Chen, X., & Han, Z. 2009, MNRAS, 395, 2103 [NASA ADS] [CrossRef] [Google Scholar]
- Meng, X., & Yang, W. 2010a, ApJ, 710, 1310 [NASA ADS] [CrossRef] [Google Scholar]
- Meng, X., & Yang, W. 2010b, A&A, 516, A47 [NASA ADS] [CrossRef] [EDP Sciences] [Google Scholar]
- Meng, X., & Yang, W. 2010c, MNRAS, 401, 1118 [NASA ADS] [CrossRef] [Google Scholar]
- Meng, X., Yang, W., & Li, Z. 2010, RAA, 10, 927 [NASA ADS] [Google Scholar]
- Neill, J. D., Sullivan, M., Howell, D. A., et al. 2009, ApJ, 707, 1449 [NASA ADS] [CrossRef] [Google Scholar]
- Nomoto, K., Thielemann, F.-K., & Yokoi, K. 1984, ApJ, 286, 644 [Google Scholar]
- Nomoto, K., Umeda, H., Hachisu, I., et al. 1999, in Type Ia Suppernova: Theory and Cosmology, ed. J. Truran, & T. Niemeyer (New York: Cambridge Univ. Press), 63 [Google Scholar]
- Nomoto, K., Uenishi, T., Kobayashi, C., et al. 2003, in From Twilight to Highlight: The Physics of supernova, ESO/Springer serious ESO Astrophysics Symposia, ed. W. Hillebrandt, & B. Leibundgut (Berlin: Springer), 115 [Google Scholar]
- Paczyński, B., & Ziólkowski, L. 1968, Acta Astron., 18, 225 [Google Scholar]
- Perlmutter, S., Aldering, G., Goldhaber, G., et al. 1999, ApJ, 517, 565 [NASA ADS] [CrossRef] [Google Scholar]
- Phillips, M. M. 1993, ApJ, 413, L105 [NASA ADS] [CrossRef] [Google Scholar]
- Pinto, P. A., & Eastman, R. G. 2001, NewA, 6, 307 [Google Scholar]
- Podsiadlowski, P., Mazzali, P. A., Lesaffre, P., et al. 2006, unpublished [astro-ph/0608324] [Google Scholar]
- Podsiadlowski, P., Mazzali, P., Lesaffre, P., Han, Z., & Förster, F. 2008, NewAR, 52, 381 [Google Scholar]
- Pols, O. R., Tout, C. A., Eggleton, P. P., et al. 1995, MNRAS, 274, 964 [NASA ADS] [CrossRef] [Google Scholar]
- Pols, O. R., Tout, C. A., Schröder, K. P., et al. 1997, MNRAS, 289, 869 [NASA ADS] [CrossRef] [Google Scholar]
- Pols, O. R., Schröder, K. P., Hurly, J. R., et al. 1998, MNRAS, 298, 525 [NASA ADS] [CrossRef] [Google Scholar]
- Pra da Moroni, P., & Straniero, O. 2002, ApJ, 581, 585 [NASA ADS] [CrossRef] [Google Scholar]
- Prieto, J. L., Stanek, K. Z., & Beacom, J. F., et al. 2008, ApJ, 673, 999 [NASA ADS] [CrossRef] [Google Scholar]
- Riess, A. G., Filippenko, A. V., Challis, P., et al. 1998, AJ, 116, 1009 [NASA ADS] [CrossRef] [Google Scholar]
- Riess, A. G., Strolger, L.-G., Casertano, S., et al. 2007, ApJ, 659, 98 [NASA ADS] [CrossRef] [Google Scholar]
- Röpke, F. K., Gieseler, M., & Hillebrandt, W. 2005, ASP Conf. Ser., 342, 397 [Google Scholar]
- Röpke, F. K., Gieseler, M., Reinecke, M., et al. 2006, A&A, 453, 203 [NASA ADS] [CrossRef] [EDP Sciences] [Google Scholar]
- Schröder, K. P., Pols, O. R., & Eggleton, P. P. 1997, MNRAS, 285, 696 [NASA ADS] [CrossRef] [Google Scholar]
- Shanks, T., Allen, P. D., Hoyle, F., et al. 2002, ASPC, 283, 274 [NASA ADS] [Google Scholar]
- Sullivan, M., Conley, A., Howell, D. A., et al. 2010, MNRAS, 406, 782 [NASA ADS] [Google Scholar]
- Taubenberger, S., Benetti, S., Childress, M., et al. 2011, MNRAS, 412, 2735 [NASA ADS] [CrossRef] [Google Scholar]
- Timmes, F. X., Brown, E. F., & Truran, J. W. 2003, ApJ, 590, L83 [NASA ADS] [CrossRef] [Google Scholar]
- Travaglio, C., Hillebrandt, W., & Reinecke, M. 2005, A&A, 443, 1007 [NASA ADS] [CrossRef] [EDP Sciences] [Google Scholar]
- Tremonti, C. A., Heckman, T. M., Kauffmann, G., et al. 2004, ApJ, 613, 898 [NASA ADS] [CrossRef] [Google Scholar]
- Umeda, H., Nomoto, K., Yamaoka, H., et al. 1999a, ApJ, 513, 861 [NASA ADS] [CrossRef] [Google Scholar]
- Umeda, H., Nomoto, K., Kobayashi, C., et al. 1999b, ApJ, 522, L43 [NASA ADS] [CrossRef] [Google Scholar]
- Wang, L., Höflich, P., Wheeler, J. C. 1997, ApJ, 483, L29 [NASA ADS] [CrossRef] [Google Scholar]
- Wang, B., Meng, X., Chen, X., & Han, Z. 2009a, MNRAS, 395, 847 [NASA ADS] [CrossRef] [Google Scholar]
- Wang, B., Chen, X., Meng, X., & Han, Z. 2009b, ApJ, 701, 1540 [NASA ADS] [CrossRef] [Google Scholar]
- Wang, B., Li, X., & Han, Z. 2010, MNRAS, 401, 2729 [NASA ADS] [CrossRef] [Google Scholar]
- Whelan, J., & Iben, I. 1973, ApJ, 186, 1007 [NASA ADS] [CrossRef] [Google Scholar]
All Tables
CO core masses (in M⊙) for different metallicities (in Z⊙, Row 1) and different initial masses (Col. 1, in M⊙).
Total carbon mass fraction of WDs before SNe Ia explosion for different metallicities (in Z⊙, Row 1) and different initial masses (Col. 1, in M⊙).
All Figures
|
Fig. 1 Abundances of several elements in mass fraction in the inner core of three models with different primordial MS masses and different metallicities at the moment of envelope ejection. The solid, dotted, dashed and dot-dashed lines represent hydrogen, helium, carbon, and oxygen abundance, respectively. Top: Z = 0.001 and Mi = 3.51; middle: Z = 0.02 and Mi = 4.52; bottom: Z = 0.06 and Mi = 4.32. |
| In the text | |
|
Fig. 2 The relation between the total carbon abundance of WDs before a supernova explosion and the initial WD mass for SNe Ia with different metallicities. The gray points represent those that might not contribute to SNe Ia. |
| In the text | |
|
Fig. 3 The relation between the total carbon abundance of WDs beforea supernova explosion, the initial WD mass and metallicity. The solid line is the best-fit linear relation, where the line fits all the points shown in Fig. 2. The lower panel shows the difference between the points and the fitted line. |
| In the text | |
|
Fig. 4 The relation between the total carbon abundance of WDs before SNe Ia explosion, the initial WD mass and metallicity, where the points which may not contribute to SNe Ia are cut off. The solid line is the best-fit linear relation. The lower panel shows the difference between the points and the fitted line. |
| In the text | |
Current usage metrics show cumulative count of Article Views (full-text article views including HTML views, PDF and ePub downloads, according to the available data) and Abstracts Views on Vision4Press platform.
Data correspond to usage on the plateform after 2015. The current usage metrics is available 48-96 hours after online publication and is updated daily on week days.
Initial download of the metrics may take a while.