Fig. 1
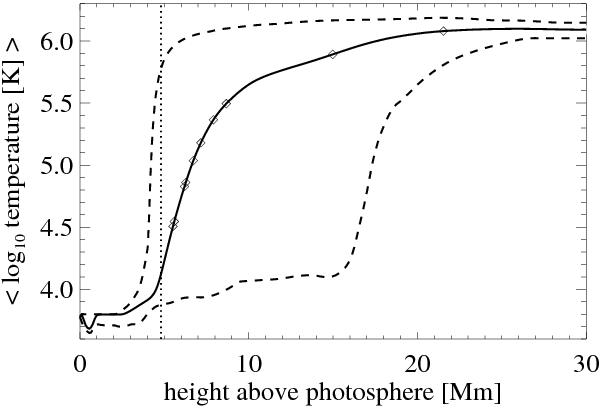
Height dependence of the average temperature in horizontal layers of the simulation box (solid line). Diamonds indicate the formation temperature of the emission lines that are investigated in this study (compare Table 1, column labeled log Tcontrib). The dashed lines show the minimum and maximum temperature in the horizontal layers.
Current usage metrics show cumulative count of Article Views (full-text article views including HTML views, PDF and ePub downloads, according to the available data) and Abstracts Views on Vision4Press platform.
Data correspond to usage on the plateform after 2015. The current usage metrics is available 48-96 hours after online publication and is updated daily on week days.
Initial download of the metrics may take a while.