| Issue |
A&A
Volume 531, July 2011
|
|
|---|---|---|
| Article Number | A43 | |
| Number of page(s) | 12 | |
| Section | Stellar structure and evolution | |
| DOI | https://doi.org/10.1051/0004-6361/201015949 | |
| Published online | 09 June 2011 | |
Polar branches of stellar activity waves: dynamo models and observations
1
School of Mathematics, University of Manchester, Oxford Road, Manchester M13 9PL, UK
e-mail: This email address is being protected from spambots. You need JavaScript enabled to view it.
2
Department of Physics, Moscow University, 119992 Moscow, Russia
e-mail: This email address is being protected from spambots. You need JavaScript enabled to view it.
3
INAF-Osservatorio Astrofisico di Catania, via S. Sofia, 78, 95123 Catania, Italy
e-mail: This email address is being protected from spambots. You need JavaScript enabled to view it.
Received: 19 October 2010
Accepted: 3 May 2011
Abstract
Aims. Stellar activity data provide evidence of activity wave branches propagating polewards rather than equatorwards (the solar case). This evidence is especially pronounced for the well-observed subgiant HR 1099. Stellar dynamo theory allows polewards propagating dynamo waves for certain governing parameters. In this paper, we try to unite observations and theory.
Methods. Taking into account the preliminary stage both of observations of polar activity branches and of the determination of the governing parameters for stellar dynamos, we restrict our investigation to the simplest mean-field dynamo models, while recognizing more modern approaches to be an essential development.
Results. We suggest a crude preliminary systematization of the reported cases of polar activity branches. Then we present results of dynamo model simulations which contain magnetic structures with polar dynamo waves, and identify the models which look most promising for explaining the latitudinal distribution of spots in dwarf stars. Those models require specific features of stellar rotation laws, and so observations of polar activity branches may constrain internal stellar rotation. Specifically, we find it unlikely that a pronounced poleward branch can be associated with a solar-like internal rotation profile, while it can be more readily reproduced in the case of a cylindrical rotation law appropriate for fast rotators. We stress the case of the subgiant component of the active close binary HR 1099 which, being best investigated, presents the most severe problems for a dynamo interpretation. Our best model requires dynamo action in two layers separated in radius. This interpretation requires some change in the paradigm of stellar magnetic studies, as it explains surface manifestations in a subgiant as a joint effect of shallow and deep layers of the stellar convective zone, rather than of a surface magnetic field only, as appears to be the case in dwarf stars.
Conclusions. Observations of polar activity branches provide valuable information for understanding stellar activity mechanisms and internal rotation, and thus deserve intensive observational and theoretical investigation. Current stellar dynamo theory seems sufficiently robust to accommodate the phenomenology.
Key words: stars: activity / stars: magnetic field / dynamo / Sun: activity / Sun: magnetic topology
© ESO, 2011
1. Introduction
It is widely accepted that the solar activity cycle is more than just a quasiperiodic variation of sunspot number, being rather an activity wave that propagates from mid solar latitudes towards the solar equator. A solar dynamo based on the joint effects of differential rotation and mirror-asymmetric convective motions in the form of the so-called α-effect (possibly together with meridional circulation) is considered to be the underlying mechanism for the propagation of activity waves. Indeed, this mechanism gives an equatorwards propagating wave of large-scale magnetic field for a suitable choice of the parameters governing dynamo action. It is natural to expect that such a phenomenon will appear in a variety of stars with convective envelopes, and we might thus be led to expect equatorwards waves of stellar activity.
In fact cyclic activity is known now for many stars of various spectral types, e.g. Baliunas et al. (1995), Oláh et al. (2009). Clarification of the spatial configuration of the assumed activity wave is a much more delicate undertaking. However contemporary astronomy possesses a range of tools, such as the technique of Doppler Imaging (hereafter DI), with which to investigate the problem. A comprehensive investigation of the problem still remains a desirable milestone for stellar astronomy; however some early results are already available, e.g. Berdyugina & Henry (2007), Katsova et al. (2010). The point here is that at least some stars exhibit an activity wave that propagates polewards.
For instance, the K-type subgiant component of the RS CVn system HR 1099 has been extensively studied through DI by, e.g., Vogt et al. (1999), and shows migration of spots from mid-latitudes towards the rotational poles on a timescale of a few years. Indirect evidence of the same phenomenon is found for several late-type main-sequence stars and young solar analogues, from chromospheric line flux monitoring or photometric optical monitoring, respectively (see Sect. 2).
A systematization of the cases where polewards migration or other features different from the solar case are deduced to explain observations.
In mean-field dynamo models, the direction of migration of the large-scale magnetic field features depends in principle on two key factors – the sign of the α coefficient in the relevant hemisphere and the radial gradient of angular velocity.
The situation is however not so straightforward. The point is that in addition to the equatorwards branch demonstrated by sunspots, the solar activity displays a relatively weak polewards branch, seen in some other tracers, e.g. polar faculae – Makarov & Sivaraman (1989). It looks implausible a priori that such weak additional branches could be responsible for stellar polewards branches, however the possibility should be recognized.
The aim of this paper is to investigate how the recent and current observational data concerning polewards branches of stellar activity might be connected with ideas from stellar dynamo theory. We appreciate that the observational situation after these pioneering results still remains quite uncertain, and so we study just the most traditional forms of stellar dynamos, i.e. mean-field dynamos based on differential rotation and α-effect with simple algebraic quenching.
More recent ideas in solar dynamo theory, such as flux transport dynamos based on meridional circulation, e.g. Durney (1995), Choudhuri et al. (1995), Dikpati & Gilman (2006), or dynamical schemes of dynamo saturation, e.g. Kleeorin et al. (2003), Subramanian & Brandenburg (2004), are certainly likely to be important. We believe however that a simple initial approach is desirable and therefore we consider a classic dynamo wave model with a simple nonlinearity as the basic model in our research. In this model, the activity wave propagation is primarily associated with the joint action of differential rotation and α-effect rather than any effects of meridional circulation. It appears however that some observational features of polewards propagation are difficult to reproduce with this simple model. Therefore, we also investigate briefly some effects of meridional circulation.
We also note the possible role of low order dynamo models in elucidating some aspects of stellar magnetic behaviour, e.g. Wilmot-Smith et al. (2006), but here we concentrate on models that we feel are more directly interpretable physically.
Previous theoretical investigations of stellar dynamos have focussed on reproducing the dependence of activity cycle periods on stellar parameters, in particular the rotation period (see, e.g., Noyes et al. 1984b; Ossendrijver 1997; Jouve et al. 2010, and references therein) or on explaining high-latitude or polar spots that are not observed in the Sun (e.g., Granzer et al. 2000; Holzwarth et al. 2006; Işik et al. 2007). We present here for the first time a tentative systematization of the stellar butterfly diagrams that are now emerging from the observations, and try to explain the different behaviours by means of a simple mean-field dynamo model.
We stress that our primary aim is not to produce “definitive” mean-field models for any of the observed behaviours. Rather we attempt to illustrate the degree of uncertainty inherent in mean-field parametrizations, and also to show that many behaviours are reproducible by such models. Whilst the fundamental shortcomings of mean-field theory have attracted much interest, rather less attention has been given to, for example, investigating differences in behaviour caused by modest changes to parametrizations. This is, of course, two-edged. It reduces any predictive power of mean-field modelling, but also illustrates the possibility of explaining non-standard behaviours by more unusual regimes.
2. Butterfly diagrams and polewards activity waves for solar-like stars
We introduce some tentative systematization of the information concerning the migration of activity patterns as derived from available observations. Distinct cases are summarized in Table 1, which lists also our dynamo models with features resembling those observed (see Sect. 4), and are briefly described below. They are listed in order of increasing Rossby number (Ro), that is the ratio of the rotation period of the star to the convective turnover time at the base of the convection zone; Ro can be roughly related to the dynamo number in the bulk of the convection zone (cf. Noyes et al. 1984a).
-
Case I:
Among the RS CVn systems, the K-type component of HR 1099 has a record of DI maps extending over about twenty years with simultaneous coverage in wide-band optical photometry (cf., e.g., Strassmeier 2009). Berdyugina & Henry (2007), extending previous work by Lanza et al. (2006), built maps of the distribution of starspots on the active K-type subgiant. Two main active regions were found, one migrating from high latitudes (≈ 70°) towards mid-latitudes (≈ 40°), the other from mid-latitudes (≈ 40°) towards high latitudes (≈ 70°), these occurring more-or-less simultaneously. Several other RS CVn binaries show a general behaviour similar to that of HR 1099, although their DI and photometric time series are less extended or have a more limited simultaneous coverage. A characteristic of the active components of RS CVn binary systems is the presence of a polar spot that persists with little modification over timescales of decades, and which may be due to the advection of magnetic flux to the polar region of the star by diffusion or meridional flows, e.g. Schrijver & Title (2001); Mackay et al. (2004); Holzwarth et al. (2006). In contrast, starspots at intermediate and low latitudes seem to follow a cyclic migration that might be associated with an oscillating dynamo, cf. Strassmeier (2009).
-
Case II:
In young, rapidly rotating stars, such as AB Dor (Prot = 0.51 days) and LQ Hya (Prot = 1.66 days), DI has revealed the simultaneous presence of spots at high and low latitudes, as well as a polar spot which has not been observed in all seasons, thus indicating a less persistent feature than in the case of the RS CVn systems (e.g., Kovári et al. 2004). In AB Dor, the spots at low and intermediate latitudes do not appear to migrate significantly (Järvinen et al. 2005; Jeffers et al. 2007), in contrast to the case of HR 1099 (case I above).
-
Case III:
Solar-like stars with a rotation period of about 5–40 days have been studied through the long-term monitoring of their chromospheric flux variations, mainly in the framework of the classic Mt. Wilson H&K project and its recent extensions, e.g. Baliunas et al. (1995), Baliunas et al. (1998), Hall & Lockwood (2004). Donahue & Baliunas (1994) report that 36 stars out of about 100 have several determinations of their rotation period extending over several seasons. Among them, 21 show patterns of rotation that vary with time or with the phase of the activity cycle. Specifically, 12 stars display a pattern that resembles that which would be expected from the solar butterfly diagram, although in six of them the rotation period increases as the cycle progresses, in contrast to the solar case. One of the best examples is HD 114710, see Donahue & Baliunas (1992). The dwarf stars showing anti-solar behaviour seem unlikely to possess an anti-solar pattern of surface differential rotation, i.e. with the poles rotating faster than the equator, because this has never been found from DI observations (Barnes et al. 2005), or from theoretical models of stellar rotation (e.g. Rüdiger et al. 1998). Therefore, a plausible explanation is that their active regions migrate polewards rather than equatorwards, which is what we define as case III.
-
Case IV:
There is another possibility to produce the phenomenology described in Case III. If stellar activity is not confined to latitudes close to the equator, but is well extended towards the poles, in addition to a polewards dynamo wave there can be another wave propagating from intermediate latitudes towards the equator. Which of the two waves dominates the modulation of the stellar flux depends on the inclination of the rotation axis with respect to the line of sight. If the star is viewed approximately pole-on, the polewards branch will dominate and the observed behaviour is anti-solar, while if the inclination is low, the star shows a solar-like behaviour because the low-latitude branch dominates, as suggested by, e.g., Messina & Guinan (2003).
-
Cases V and VI:
Among the stars considered by Donahue & Baliunas (1994), there are four stars that seem to reverse the trend of rotation period variation at mid-cycle; six stars that show two narrow, but well separated bands of rotation, suggesting two stationary active latitude belts – we define this as case V; and, finally, stars that have hybrid patterns with one band showing a variation of the rotation period versus the cycle phase, while the other remains fairly constant – we take this behaviour to be representative of case VI. Stars with one or two fixed rotation periods as determined from Ca II H&K monitoring might be characterized by a standing dynamo wave, e.g. Baliunas et al. (2006).
Cases III, IV, V, and VI could be different manifestations of the same kind of activity behaviour, which appear distinct, either because of a different inclination of the stellar rotation axis which emphasizes either the polar or the equatorial region of a star, and/or a different intensity of the activity, or a phase shift between the polewards and the equatorwards branches of the butterfly diagram during the activity cycle. The available observations are still too limited to arrive at any sound conclusion on this point. Therefore, we prefer to consider all the suggested behaviours separately because each case makes a specific requirement for the theoretical butterfly diagram.
3. Mean-field dynamos
Now we address the problem from the other aspect and discuss how the butterfly diagrams appear in an assortment of stellar and solar-like dynamo models. We discuss here the simplest cases from the viewpoint of dynamo theory, i.e. standard mean-field dynamos, e.g. Rüdiger & Hollerbach (2004), with conventional boundary conditions and numerical implementation, e.g. Brandenburg & Subramanian (2005).
We investigate solutions of the standard mean field dynamo equation:
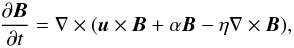 (1)where η is the turbulent diffusivity and α represents the usual isotropic alpha-effect. The velocity field
  , where Ω is the angular velocity of rotation, ϖ the distance from the rotation axis,
  the unit vector in the azimuthal direction, and um the meridional flow. We restrict our investigation to axisymmetric solutions and solve the dynamo problem in a spherical shell, r0 ≤ r ≤ 1, where r is the fractional radius. We adopt r0 = 0.64 for many of the models, but we also investigate models with a deeper dynamo region with r0 = 0.2.
When modelling stellar magnetic fields, it is necessary to ensure that the field in the interior joins smoothly on to a force-free field in the external, very low density, region. Splitting the magnetic field into poloidal and toroidal parts, B = BP + BT, the Lorentz force can be written as 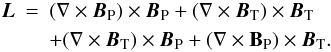 (2)For an axisymmetric field, the last term is identically zero, the first two are poloidal vectors and the third is toroidal. In the present case BT = Bφ. The condition L = 0 can be satisfied by setting Bφ = 0 and ∇ × BP = 0; this provides the boundary condition on the interior field applied at r = 1. At the lower boundary we use “overshoot” boundary conditions, simulating the decay of the field to zero over a skin depth δ, in the form ∂g/∂r = g/δ, where g represents the azimuthal component of the vector potential for the poloidal field, or the toroidal field. These boundary conditions have been used before, and have been shown to have no significant effect on the results, except to reduce some field gradients near the base of the convective region.
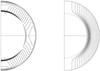 |
Fig. 1 Equally spaced isorotation contours for the solar rotation law used (left hand panel) and contours for our quasi-cylindrical law for rapid rotators (right hand panel). |
Models with a solar-like rotation law, based on that derived from helioseismology, and also models with a quasi-cylindrical rotation law appropriate to rapidly rotating lower mass dwarfs, are studied (Fig. 1), with a variety of choices for α(r,θ) = Cαf1(r)f2(θ)/ [1 + (B/B0)2 ] , i.e. a naive α-quenching nonlinearity is used,where θ is the colatitude measured from the North pole and B0 a reference magnetic field (see below).
Different physical mechanisms can co-operate to produce the α-effect and theoretical or observational (e.g. Zhang et al. 2010) knowledge of its radial and colatitudinal distributions, here expressed through the functions f1(r) and f2(θ), is quite preliminary. Therefore, we adopt only simple parametrizations and explore a number of options to investigate the sensitivity of butterfly diagrams to the underlying assumptions. The turbulent diffusivity η is uniform in the outer part of the convection zone (r ≥ 0.8), but decreases linearly to one half that value in the domain r ≤ 0.7.Below the CZ proper we expect an overshoot region, where the turbulent intensity, corresponding to the turbulent resistivity, is further reduced. In Moss & Brooke (2000) (which uses the Malkus-Proctor feedback onto the differential rotation as the sole nonlinearity, as opposed to the algebraic alpha-quenching here), only token recognition of this effect was made for computational reasons. We have followed the same procedure here, recognizing that the gradient in turbulent diffusivity should be larger. Another way of regarding this is to consider the model as having a rather deeper CZ, extending to radius r0. From this viewpoint, the lower boundary condition, that allows a penetration of the field with a skin depth of the order of δ, corresponds to the effect of a strongly reduced diffusivity immediately below the boundary.
We make the dynamo equation non-dimensional in terms of the stellar radius R, the diffusion time R2/η0, where η0 is the maximum turbulent diffusivity, and the magnetic field B0 defined as in Sect. 3 of Moss & Brooke (2000). Thus we introduce the standard dynamo numbers, Cα = α0R/η0,Cω = Ω0R2/η0, where α0 is a typical value of α and Ω0 is the maximum value of the angular velocity. In the αω approximation, we can define the combined dynamo number D = CαCω, and this remains a useful quantity even in α2ω models.
To integrate the dynamo equation, we use the code described in Moss & Brooke (2000), which uses a Runge-Kutta integrator over a standard mesh with 61 points over r0 ≤ r ≤ 1, and 101 points over 0 ≤ θ ≤ π, equally spaced. The results are described in Sect. 3.2.
A useful simplification of the general axisymmetric mean-field dynamo Eq. (1), known as the Parker migratory dynamo, is considered in Sect. 3.1 and is written in a standard non-dimensional form as: 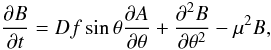 (3)
(3)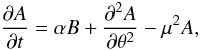 (4)wheref is a factor that allows for a latitudinal variation of the radially averaged angular velocity (see Sect. 3.1), α is a nondimensional measure of the α effect, D = CαCω is the dynamo number, B denotes the toroidal magnetic field and A the toroidal component of the vector potential for the poloidal field. Both latter quantities are averaged in radial direction over the convective shell,see Baliunas et al. (2006). In other words, here the explicit radial dependence has been removed, and the terms involving μ2 represent radial diffusion in a spherical shell of thickness approximately μ-1 of the outer radius of the shell – e.g. μ ≈ 3 is appropriate for the solar convection zone.We solve Eqs. (3) and (4) in the domain 0 ≤ θ ≤ π with A = 0, B = 0 at the boundaries.

3.1. Polar branches in the 1D Parker dynamo
We begin with a simple cartoon which explains the idea of stellar dynamos, i.e. with the 1D Parker (1955) dynamo.
First of all, we estimate the latitudinal variation of Ω, averaged over fractional radii (0.69, 1) from a realistic solar rotation law (Fig. 1, left hand panel). Normalized to the polar value of the gradient, the modulation compared to that with no latitudinal variation is modelled by a function f(θ) (Fig. 2). Then we ran the Parker dynamo with the usual dynamo number, D = D0 say, replaced by D = D0f(θ), so f(θ) = 1 gives the standard case.
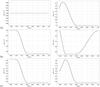 |
Fig. 3 The function f1(r) (which determines the radial dependence of the unquenched α-term). Row a), iα = 0,1; row b), iα = 2,3; row c), iα = 6,7. |
We take α = cosθsinmθ, with m = 0,2,4. The larger the value of m, the more concentrated around the equator the α effect. This simple parametrization has been used by other authors, e.g. Rüdiger et al. (2003), Charbonneau (2010), and we also adopt it here. We stress the inherent uncertainty in the spatial dependence of α and refer to, e.g., Rüdiger & Brandenburg (1995) for some justification in the framework of mean field theory with a specific turbulence model. Specifically, they explore an α effect dependence with m = 2 that is suggested by the extension of their turbulence theory to third order terms in Ω·U ∝ cosθ, where Ω is the angular velocity vector of the star and U the vector of the gradient of the turbulent diffusivity that points in the radial direction. In principle a further extension of the theory to the fifth degree in Ω·U would introduce terms proportional to sin4θ as we assume in our simple parametrization with m = 4 (of course we should then also consider expressions for alpha containing a combination of these dependences, but we decided that this was beyond the scope of this paper). Note also that the α effect may have a component arising from magnetostrophic waves excited in the layers where the toroidal field is amplified and stored. This would lead to terms with m > 0 in the parametrization of the latitudinal dependence of the α effect (see, e.g., Schmitt 1987).
We emphasize that calculations of α from turbulence models are necessarily severely truncated, and stellar dynamos operate in regimes remote from those in which such calculations are valid. Also, if we consider the potentially more useful, but more problematical, method of obtaining parametrizations of α from analysis of direct numerical simulations, it would be surprising if m = 0 or m = 2 or a combination was adequate. However such determinations are currently contentious, in spite of substantial progress, from the early attempts (e.g. Brandenburg & Sokoloff 2002) to the most recent (e.g. Courvoisier & Kim 2009; Brandenburg et al. 2010; Tobias et al. 2011). Realistically, a reliable determination for specific types of stars remains a remote possibility.
With these assumptions on the rotation profile and the alpha effect, we solve the 1D dynamo Eqs. (3) and (4). With D0 < 0 then, as expected, the activity wave propagates equatorwards. The main effect is with the variation of m, larger values of m move the migration nearer to the equator.
With D0 > 0, m = 0 then, again as expected, there is polewards migration, centred on mid-latitudes, both with f(θ) = 1 and with f(θ) nonuniform. When f(θ) is nonuniform, the butterfly diagram is concentrated at high latitudes for modestly supercritical D0, while solutions become steady for more supercritical values of D0.
With m = 2 and f(θ) = 1, again behaviour is much as expected, but quite unexpectedly with f(θ) as in Fig. 2 and m = 2,4, the solutions are steady for only marginally supercritical values of D0. These statements are all for solutions with dipole parity, but steady solutions are also found when quadrupole parity is enforced.
Except when explicitly stated, all the above experiments were made with a slightly supercritical |D0| and with a decay term which mimics radial diffusion for the value of the ratio μ-1 = h/R = 1/3, where R is the stellar radius and h the thickness of the convective zone, e.g. Baliunas et al. (2006). We deduce that, even with this simple dynamo model, behaviour can be remarkably rich and broad conclusions cannot be drawn without a quite careful exploration of the parameter space and the form of f(θ).
3.2. 2D dynamo models
3.2.1. Solar rotation law
Now we turn our attention to 2D models and start by using a solar-like rotation law within fractional radii 0.64 ≤ r ≤ 1.0, as shown in the left hand panel of Fig. 1. In r ≥ 0.7 this is an interpolation on MDI data, and is made to match uniform rotation at the lower boundary r = r0 = 0.64.
A dynamo shell with a lower boundary at r0 = 0.64 of the stellar radius is a good assumption for G and K type main-sequence stars, but it is not appropriate for a subgiant such as the K1IV active component of HR 1099. Given the current uncertainty on the evolutionary stage of the star, r0 = 0.2 is a reasonable assumption (cf., e.g., Lanza 2005). Because extensive numerical simulations to cover realistic values for this (and many other) dynamo governing parameters are obviously beyond the scope of the paper, we restricted our investigation here to extrapolations that seem reasonable on the basis of available knowledge.
Several forms of the functions f1(r),f2(θ) are used: f2(θ) = cosθsinmθ, with m = 0,2,4, and f1(r) takes the forms shown in Fig. 3, referred to below as iα = 0,1,2,3,6,7, as denoted in the caption. There are thus 18 possible forms of α(r,θ).
A standard value Cω = ΩeqR2/η0 = 6 × 10⁴ was taken. The other dynamo number, Cα, was given a slightly supercritical value. The results are summarized in Table 2.
Only odd parity (dipole-like) solutions were studied. Models 1–18 have Cα < 0, the conventional fix to get near-surface fields migrating in the solar sense. Models 19–30 (not all numbers present) have Cα > 0. Latitude-time diagrams for the pairs (1, 19), (6, 24), (8, 26), and (12, 30), which have the same values of the parameters iα and m and the same |Cα|, are shown in the top four rows of Fig. 4. Here and below, “near-surface” refers to a fractional radius of ca. 0.93, and “deep” to radius ca. r = r0.
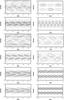 |
Fig. 4 Butterfly diagrams for the sub-surface field. Left hand column has Cα < 0, right hand column has Cα > 0. Rows 1–4 have the quasi-solar rotation law, rows 5 and 6 the quasi-cylindrical law. First row: Models 1 and 19 with iα = 3,m = 4. Second row: Models 6 and 24 with iα = 1,m = 4. Third row: Models 8 and 26 with iα = 0,m = 2. Fourth row: Models 12 and 30 with iα = 1,m = 2. Fifth row: Models 1c and 13c, with iα = 3,m = 2. Bottom row: Models 7c and 19c, with iα = 3,m = 4. |
The general features of the solutions with solar-like rotation law. EW, PW, SW denote equatorwards, polewards, standing wave respectively for migration of Bφ in a near-surface layer.
3.2.2. Meridional circulation
Here we investigate the effects of an arbitrarily imposed meridional circulation, in addition to solar-like differential rotation and α-effect, on the butterfly diagram.
We take a circulation determined by a stream function:  (5)so that
 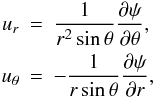 (6)where r0 = 0.64 corresponds to the base of the dynamo region. (Taken literally, in the solar case this implies the circulation penetrating into an overshoot region, but limited experimentation with the circulation restricted to r > r0 = 0.7 suggests little difference.) Here Rm = U0R/η0, where U0 is the maximum value of uθ at the surface. This circulation has a single cell in each hemisphere, with polewards flow at the surface if Rm > 0. The streamlines ψ = const are shown in Fig. 5.
In our models, the α effects and the maximum of the angular velocity shear are not spatially separated, as in, e.g., flux transport models based on the Babcock-Leighton paradigm (e.g., Dikpati & Charbonneau 1999). Therefore, the meridional flow does not play the crucial role it has in those kinds of models, but it can still modify the migration of the activity waves in a given layer when its speed there becomes comparable to the migration speed of the wave in the absence of circulation which is mainly established by the product |α∂Ω/∂r|.
We first look at Model 26 (with a solar-like rotation). In the absence of any meridional circulation, the near-surface migration is equatorwards (Table 2), but the deep butterfly diagram has polewards and equatorwards branches, the polewards being somewhat stronger, see Fig. 6, top panel. In the presence of our one-cell circulation, polewards at the surface, the near-surface migration remains equatorwards for Rm ≲ 40, but the deep equatorwards branch is strengthened, see the lower panels of Fig. 6. For larger values of Rm, the near-surface migration acquires a weak polewards branch when Rm ≳ 100, but the deep migration develops two discrete patterns that are close to standing waves. Note also that, here and below, we do not claim to have explored exhaustively the parameter space, but just to have sampled a few, we hope fairly representative, solutions. Other behaviours may well remain to be found.
The general features of the solutions with the quasi-cylindrical rotation law. EW, PW denote equatorwards, polewards respectively for Bφ migration in a near-surface layer.
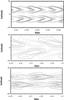 |
Fig. 6 Butterfly diagrams for Model 26 (solar rotation, Cα > 0,iα = 0,m = 2): top – without meridional circulation (Rm = 0), bottom of the convection zone; middle – Rm = 20, sub-surface; bottom – Rm = 20, bottom of the convection zone. Solid/broken contours denote positive/negative values of Bφ respectively. |
3.2.3. Quasi-cylindrical rotation law
Here a quasi-cylindrical rotation law, as Covas et al. (2005) and shown in the right hand panel of Fig. 1, is used. We take Cα = −11.7,Cω = 1.3 × 10⁵, i.e. significantly supercritical values that might correspond approximately to Ω = 3Ω⊙. Exceptionally, Models 13 and 19 have Cα = + 11.7 > 0. Results are summarized in Table 3 (note that these models are labelled “1c” etc. to distinguish them from the models with a solar-type rotation law). Butterfly diagrams for the sub-surface toroidal field for the pairs of Models (1c, 13c), and (7c, 19c) are shown in Fig. 4 in the fifth and sixth rows, respectively. The models in each of these pairs have the same parameters, except that for 13c and 19c, Cα > 0.
3.2.4. An intermediate rotation law
Although several stars in our study are quite rapid rotators, the cylindrical rotation law discussed in the previous section is not the only possibility for their rotation. It appears plausible that a regime intermediate between the solar-like and the quasi-cylindrical rotation laws may be more appropriate for such stars. Therefore, we explored the butterfly diagram obtained by adopting such a synthetic rotation curve, i.e., mixing these laws with weights of about 50% (Fig. 7). Using this Ω(r,θ), we obtained butterfly diagrams for Bφ in both the deep and shallow parts of the convective zone. These are characterized by field migrating from low and high latitudes towards some intermediate latitude, even without including any meridional circulation (Fig. 8). Neither the solar-like nor the quasi-cylindrical rotation laws produced such a behaviour.
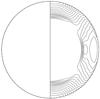 |
Fig. 7 Synthetic rotation curve from combining solar-like and quasi-cylindrical rotation laws with 50% weighting. |
The variety of butterfly diagrams obtained with the intermediate rotation law and the deep convective zone (r0 = 0.2). Some intermediate cases, not tabulated, were also found.
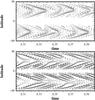 |
Fig. 8 Butterfly diagrams for the synthetic rotation law (combination of solar-like and quasi-cylindrical): top panel – shallow, lower panel – deep parts of the convective zone. |
3.2.5. Models with a deep convection zone
Since r0 = 0.64 probably gives a CZ that is too shallow for HR 1099, we experimented with models having a deeper dynamo zone (r0 = 0.2), with both solar-like and quasi-cylindrical rotation laws and also their equally weighted combination. The role of a simple meridional circulation, as parametrized by Rm, was also considered (cf. Sect. 3.2.2).
In general, the deep convective zone appears to favour steady solutions when Rm ≠ 0, or standing wave (SW) solutions. The latter may partially be due to the restricted latitudinal extent at the bottom of a deeper convective zone. This conclusion agrees with the previous results of Moss et al. (2004).
The solar rotation law sometimes gives low latitude equatorwards and high latitude polewards branches simultaneously present near the surface, similar to the models for solar-like stars with r0 = 0.64 previously discussed. With Cα < 0, with the quasi-cylindrical rotation law, deep and surface migration was either SW or equatorwards depending on the sign of Rm, and becomes steady for large enough |Rm|. If Cα > 0, then solutions with polewards surface migration and SW or vacillatory (V) behaviour deep down were found for Rm > 0. With Rm < 0, for the same Cα surface migration patterns were a combination of SW and equatorwards, again with SW in the deep CZ. Again solutions are steady for large enough |Rm|. The richest choice of possibilities was obtained for the intermediate rotation law with Cα and Rm varying (Table 4). It is notable that examples with surface polewards migration were not found.These investigations clearly demonstrate that the effects of advection can dominate the basic dynamo wave when Rm is significantly non-zero. We conclude that none of these butterfly diagrams can reproduce the phenomenology observed in HR 1099 (case I of Sect. 2).
A more promising result (Fig. 10) can be obtained when using an α profile which changes sign with depth(see Fig. 9)which gives clearly opposed waves near top and bottom of the convective zones1. In this case, we only investigated the quasi-cylindrical rotation law for a very limited range of dynamo parameters. This result is consistent with the results of Moss & Sokoloff (2007) concerning dynamo waves propagating in two separate layers, and allows the behaviour sought with appropriate choices of Cα in the two layers. The separation of the layers, that was assumed by Moss & Sokoloff (2007) arbitrarily, may be achieved here by exploiting the freedom given by the depth of the convective zone. Of course, this assumes that the deep and surface magnetic fields somehow jointly contribute to the surface activity manifestations (see Sects. 4 and 5).
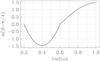 |
Fig. 9 Dependence of α on radius at θ = π/4 for the case where α changes sign with radius. |
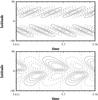 |
Fig. 10 Butterfly diagrams resembling that of HR 1099 for a deep convective zone with a change of sign for α (Fig. 9), quasi-cylindrical rotation, iα = 0: sub-surface (upper panel) and deep (bottom panel). |
4. Comparison of the 2D dynamo models with the observations
With the solar rotation law, details of migratory patterns are sensitive to the spatial dependence of α, and even the general rule that the direction of migration is governed by the sign of CαCω appears not always to hold true. The most striking case is that of Models 8 and 26 – see the third row of Fig. 4. Model 8 (left panel) has Cα < 0 and shows a strong polewards branch in addition to an equatorwards low-latitude branch. Reversing the sign of Cα but maintaining the same rotation law and spatial structure of the α effect, we see only a pronounced equatorwards branch, contrary to simple intuitive expectation. The effect of switching from Cα < 0 to Cα > 0 is also remarkable and not simply intuitive for Models 6 and 24 (on the second row of Fig. 4) and for Models 12 and 30 (on the fourth row); these differ in the latitudinal localization of the α effect (m = 4 and m = 2, respectively).
With the quasi-cylindrical rotation law, migratory patterns are quite insensitive to the exact form of α, the only significant change occurs when the sign of CαCω is reversed. The rule linking the sign of CαCω to the migration direction appears to hold. Plausibly this is because the spatial structure of Ω is much simpler than in the solar-like case, and α cannot be “tweaked” so as to give extra weight to regions of the envelope with anomalous gradients of Ω, unlike in the solar case.
Our general impression from the above analysis can be summarized as follows. Dynamo models with r0 = 0.64 and a fixed sign of α through the CZ can provide polewards migrating patterns, and observers understand activity in some stars as a manifestation of a polewards propagating pattern (see cases III and IV in Sect. 2). Models with a solar-like rotation law tend to show both equatorwards and polewards branches, the latter with an intensity that depends on the spatial distribution of the α effect. It is possible to reproduce case IV by, e.g., Model 8, while the case with a stronger equatorwards and a weaker polewards branch, reminissent of the behaviour observed in the Sun, can be compared with Model 6 (see Fig. 4, left hand panel in the second row). The case with polewards migration only, i.e. case III of our classification, is unlikely to be reproduced with a solar-like rotation law, but can be reproduced with a cylindrical law (cf. e.g. Model 13c with Cα > 0, the right hand panel, fifth row of Fig. 4). This rotation law may be characteristic of stars rotating significantly faster than the Sun (see, e.g., Lanza 2005).
On the other hand, a pattern of spots extending from the high to the low latitudes without any clear evidence of migration during the activity cycle (case II in Sect. 2), may be interpreted by, e.g. Model 24 (see Fig. 4, right hand panel in the second row). That model is characterized by a stationary pattern spanning a latitude range from the equator up to ~ 65° − 70°. Also Model 19 (Fig. 4, right hand panel, first row) shows a similar stationary pattern, but more localized in latitude. Model 12 (Fig. 4, left hand panel of the fourth row) shows a weak polewards branch that, although probably not capable of producing photospheric spots, could be detectable through the chromospheric Ca II H&K flux modulation. Therefore, it might correspond to our case VI because the pattern localized in latitude gives rise to an almost constant primary periodicity in the chromospheric flux modulation, while the migrating branch produces a secondary periodicity that varies along the activity cycle.
When interpreting the observations, one should consider that the outer contours of the model butterfly diagrams can be affected by the turbulent diffusion. Nevertheless, the direction of migration, which is the relevant information for our study, is not modified, as can immediately be seen by considering the direction of migration given by the interior contours of the diagrams that correspond to increasingly stronger fields. In some of the diagrams, such as those of Model 6 (on the left second row in Fig. 4) or Model 12 (on the left fourth row) we plot only one contour to represent the polewards branch, but the reality of that branch is confirmed by more detailed investigation. (A single contour merely indicates that the field strength in that branch is relatively small.) Moreover, turbulent diffusion in our model is uniform in the outer layers of the convection zone which implies that it cannot favour a specific direction of migration of the field, i.e. it does not introduce any preference for equatorwards or polewards motion of butterfly contours.
In the case of HR 1099 (case I of Sect. 2), the point is that the image of polewards patterns extracted from the observations is quite different from that emerging from the theory in all the models with r0 = 0.64 introduced in Sect. 3.2, irrespective of the adopted rotation law or the inclusion of a meridional circulation. We recall that HR 1099 displays two patterns that migrate in opposite directions, and the migration that begins nearer to the equator is polewards.
If there is simultaneous migration polewards and equatorwards through the same latitudes, then it is difficult to see how any simple mean-field model can reproduce it. We attempt to interpret the two oppositely propagating activity patterns as originating from different spatial volumes (see Sect. 3.2.5). Specifically, in the case of HR 1099, we need to consider an α effect that changes sign with radius or the presence of two distinct dynamo layers with opposite signs of α. The main difference with respect to the models with r0 = 0.64 is that now we consider the contribution to surface activity from both the deep and the shallow dynamo layers, while in the other cases we assumed that the field pattern at the top of a single dynamo layer directly accounts for the observed butterfly diagram.
We recognize that there are unresolved difficulties with this idea. For example, there is the problem of storing toroidal fields in relatively shallow superadiabatic layers without a too rapid loss through buoyancy instabilities. This issue has been addressed, inter alia, by Brandenburg (2005, 2009). We note in passing that in our model the toroidal field strength in the upper region is about 20% of that in the lower. This might assist downward turbulent pumping to stabilize the field by its reduced magnetic buoyancy force (proportional to B2), possibly acting preferentially at the base of a stellar supergranular layer analogous to the solar supergranulation (but at a somewhat greater depth because the convection in a subgiant is expected to have larger vertical scales). Turning back to the Sun, other difficulties for a dynamo model operating in the subsurface shear layer may include an incorrect phase difference between poloidal and toroidal fields and a too weak toroidal field due to the strong turbulent diffusion expected in those highly superadiabatic layers, cf. Dikpati et al. (2002).
Nevertheless, we can attempt to reverse the argument: from both general considerations about mean-field models, and our particular simulations, we are unable to identify a mechanism to produce the simultaneous presence of polewards and equatorwards migration co-located in latitude, other than that discussed above. Thus we conclude that either this or a related mechanism does indeed operate, or that the phenomenon is beyond the scope of mean-field theory.
Note that Berdyugina & Henry (2007) stress the nonaxisymmetric behaviour of HR 1099 and other active stars, whereas we restrict ourselves to axisymmetric models. We fully realize that departures from axisymmetry may play a role in the phenomena displayed by HR 1099, cf. e.g. Moss et al. (2002), and seem essential to explain the “flip-flop” phenomenon, e.g. Moss (2004). However nonaxisymmetric dynamo models contain many additional uncertainties and the main features of the observations seem to be reproduced by a simpler model.
5. Discussion and conclusions
Our general conclusion is that it is becoming realistic to construct a framework for classification ofthe very varied stellar dynamo wave behaviours, and to relate this to physical parameters of stellar convective zones. We have presented above a very crude and preliminary outline for such a template.
We confirm that the sign of D = CαCω ~ α∂Ω/∂r is the main quantity which determines the direction of activity wave propagation,even though considerable finer detail can be found in the results, e.g. in the form of two branches at low and high latitudes, or of standing wave patterns (cf. Sect. 4 and Fig. 4). However, quite unexpectedly, we conclude from the above plots that even if D > 0 it is quite difficult to excite a pronounced single polewards branch in stars with a solar-like rotation law. It follows that straightforward considerations based on the sign of dynamo number D are inadequate to understand the occurence of polewards branches, and a careful examination of 2D models is important. In our investigation, we consider only the direction of dynamo wave migration and do not attempt to fit the observed spot latitudes. The direction of migration (or standing wave behaviour) appears to be a robust result that does not depend on the details of the butterfly wings (which may be influenced by physical processes that we have not considered).
Observations give a hint that one hemisphere of a star can contain two oppositely propagating activity waves which are pronounced enough to be observable. We find that, at least for some stars, rotation curves and spatial distribution of the other dynamo governing quantities should produce two activity patterns in a hemisphere, of more or less comparable intensity. A phase difference between the equatorwards and the polewards dynamo waves can exist. This idea emerges from looking at the butterfly diagram for Model 1 (top left panel of Fig. 4), where there is a difference in the field intensity of the two branches as well as a phase shift between the epochs when the low-latitude branch reaches the equator and the high-latitude branch reaches the highest latitude.
The fundamental result of our investigation is that the spot migration observed in main-sequence stars or the presence of standing activity waves can be explained by considering the time evolution of the magnetic field at the upper boundary of a dynamo shell, even in a very simple dynamo model. The various behaviours can be reproduced by changing the spatial structure of the α-effect and/or the internal rotation law. Also a meridional flow may play a role.
The other important point is that the behaviour of HR 1099 cannot be explained by our simple one-layer models and the inclusion of a meridional circulation does not change this conclusion. On the other hand, a two-layer model, somewhat similar to that introduced by Moss & Sokoloff (2007), can explain the behaviour of HR 1099 if the two spots migrating in opposite directions are the result of magnetic flux tubes originating in the upper and deeper dynamo layers, respectively. However, this interpretation requires a significant modification of the paradigm used for main-sequence stars. In other words, while for main-sequence stars we use a single-layer dynamo and assume that the observed spots correspond to the field at the upper boundary of the dynamo domain, for the subgiant in HR 1099 (and for subgiant stars in general) we must assume the presence of two dynamo layers separated by an inactive shell, with both layers contributing to the observed spots at the surface.
From the viewpoint of dynamo theory, we have shown that by exploiting the considerable range of freedom in choosing ill-known physical quantities, we can produce a wider range of activity wave behaviour than had previously been realized – indeed we can find something approaching the observed range of stellar surface activity waves. Of course, theory cannot at present say which of the models (if any) correspond even loosely to reality. We just make the point that the various observed behaviours are not incompatible with even simple dynamo models. The inherent uncertainties of mean field models make it difficult to make a stronger or more useful statement than this. It remains to be clarified, for example, whether there is a correlation of the dynamo wave behaviour with the absolute value of the dynamo number, as suggested by our ordering of the cases in Sect. 2 by increasing values of Ro. To take just one point considering a solar-like rotation, when the dynamo number is large (and Ro is small) we generally see two waves with comparable magnetic field strength, starting from mid latitudes and migrating towards the pole and the equator, respectively. On the other hand, when the dynamo number is small (and Ro is large) the equatorwards wave has a stronger field than the polar wave. Further observational evidence and characterization of polewards waves would be of special interest and value. Also the simultaneous presence of a standing dynamo wave at a fixed latitude together with a migrating wave is of interest in interpreting the behaviour of some of the Mt. Wilson stars.
Finally, we have of necessity based this exploratory paper on a rather small number of relatively well observed stars (and of a small subset of all possible dynamo models). We thus make the usual plea for more, reliable, data in order to substantiate (or disprove) our attempts at systematization.
Turbulent convection simulations by Käpylä et al. (2009) do indeed show an α effect that changes sign from the bottom to the top of the convective domain (cf. the sign of their tensor coefficient αyy, that corresponds to the scalar coefficient α of our simplified mean-field model, in their Figs. 3 and 12).This effect also appears when α is determined from some turbulence models – see e.g. Brandenburg & Subramanian (2005) and references therein.
Acknowledgments
The authors are grateful to an anonymous referee for a careful reading and several useful comments on an earlier version of the manuscript. D.S. acknowledges financial support from RFBR project 09-05-00076.
References
- Baliunas, S. L., Donahue, R. A., Soon, W., et al. 1995, ApJ, 438, 269 [NASA ADS] [CrossRef] [Google Scholar]
- Baliunas, S. L., Donahue, R. A., Soon, W., & Henry, G. W. 1998, in Cool Stars, Stellar Systems and the Sun, ed. R. A. Donahue, & J. A. Bookbinder, ASP Conf. Ser., 154, 153 [Google Scholar]
- Baliunas, S., Frick, P., Moss, D., et al. 2006, MNRAS, 365, 181 [NASA ADS] [CrossRef] [Google Scholar]
- Barnes, J. R., Cameron, A. C., Donati, J.-F., et al. 2005, MNRAS, 357, L1 [NASA ADS] [CrossRef] [MathSciNet] [Google Scholar]
- Berdyugina, S. V., & Henry, G. W. 2007, ApJ, 659, L157 [NASA ADS] [CrossRef] [Google Scholar]
- Brandenburg, A. 2005, ApJ, 625, 539 [Google Scholar]
- Brandenburg, A. 2009, Space Sci. Rev., 144, 87 [NASA ADS] [CrossRef] [Google Scholar]
- Brandenburg, A., & Sokoloff, D. 2002, GAFD, 96, 319 [Google Scholar]
- Brandenburg, A., & Subramanian, K. 2005, Phys. Rep., 417, 1 [NASA ADS] [CrossRef] [Google Scholar]
- Brandenburg, A., Chatterjee, P., Del Sordo, F., et al. 2010, Phys. Scr., 142, 014028 [Google Scholar]
- Charbonneau, P. 2010, Liv. Rev. Sol. Phys., 7, 3 [Google Scholar]
- Choudhuri, A. R., Schussler, M., & Dikpati, M. 1995, A&A, 303, 29 [Google Scholar]
- Courvoisier, A., & Kim, E.-J. 2009, PRE, 80, 046308 [NASA ADS] [CrossRef] [Google Scholar]
- Covas, E., Moss, D., & Tavakol, R. 2005, A&A, 429, 657 [NASA ADS] [CrossRef] [EDP Sciences] [Google Scholar]
- Dikpati, M., & Charbonneau, P. 1999, ApJ, 518, 508 [NASA ADS] [CrossRef] [Google Scholar]
- Dikpati, M., & Gilman, P. A. 2006, ApJ, 649, 498 [NASA ADS] [CrossRef] [Google Scholar]
- Dikpati, M., Corbard, T., Thompson, M. J., & Gilman, P. A. 2002, ApJ, 575, L41 [NASA ADS] [CrossRef] [Google Scholar]
- Donahue, R. A., & Baliunas, S. L. 1992, ApJ, 393, L63 [NASA ADS] [CrossRef] [Google Scholar]
- Donahue, R. A., & Baliunas, S. L. 1994, in Cool Stars, Stellar Systems and the Sun, Eighth Cambridge Workshop, ed. J.-P. Caillault, ASP Conf. Ser., 64, 396 [Google Scholar]
- Durney, B. R. 1995, Sol. Phys., 160, 213 [Google Scholar]
- Granzer, T., Schüssler, M., Caligari, P., & Strassmeier, K. G. 2000, A&A, 355, 1087 [NASA ADS] [Google Scholar]
- Hall, J. C., & Lockwood, G. W. 2004, ApJ, 614, 942 [NASA ADS] [CrossRef] [Google Scholar]
- Holzwarth, V., Mackay, D. H., & Jardine, M. 2006, MNRAS, 369, 1703 [NASA ADS] [CrossRef] [Google Scholar]
- Işik, E., Schüssler, M., & Solanki, S. K. 2007, A&A, 464, 1049 [NASA ADS] [CrossRef] [EDP Sciences] [Google Scholar]
- Järvinen, S. P., Berdyugina, S. V., Tuominen, I., Cutispoto, G., & Bos, M. 2005, A&A, 432, 657 [NASA ADS] [CrossRef] [EDP Sciences] [Google Scholar]
- Jeffers, S. V., Donati, J.-F., & Collier Cameron, A. 2007, MNRAS, 375, 567 [NASA ADS] [CrossRef] [Google Scholar]
- Jouve, L., Brown, B. P., & Brun, A. S. 2010, A&A, 509, A32 [NASA ADS] [CrossRef] [EDP Sciences] [Google Scholar]
- Käpylä, P. J., Korpi, M. J., & Brandenburg, A. 2009, A&A, 500, 633 [NASA ADS] [CrossRef] [EDP Sciences] [Google Scholar]
- Katsova, M. M., Livshits, M. A., Soon, W., Baliunas, S. L., & Sokoloff, D. D. 2010, New Astron., 15, 274 [NASA ADS] [CrossRef] [Google Scholar]
- Kleeorin, N., Kuzanyan, K., Moss, D., et al. 2003, A&A, 409, 1097 [NASA ADS] [CrossRef] [EDP Sciences] [Google Scholar]
- Kovári, Z., Strassmeier, K. G., Granzer, T., et al. 2004, A&A, 417, 1047 [NASA ADS] [CrossRef] [EDP Sciences] [Google Scholar]
- Lanza, A. F. 2005, MNRAS, 364, 238 [NASA ADS] [CrossRef] [Google Scholar]
- Lanza, A. F., Piluso, N., Rodonò, M., Messina, S., & Cutispoto, G. 2006, A&A, 455, 595 [NASA ADS] [CrossRef] [EDP Sciences] [Google Scholar]
- Mackay, D. H., Jardine, M., Cameron, A. C., Donati, J.-F., & Hussain, G. A. J. 2004, MNRAS, 354, 737 [NASA ADS] [CrossRef] [Google Scholar]
- Makarov, V. I., & Sivaraman, K. R. 1989, Sol. Phys., 123, 367 [NASA ADS] [CrossRef] [Google Scholar]
- Messina, S., & Guinan, E. F. 2003, A&A, 409, 1017 [NASA ADS] [CrossRef] [EDP Sciences] [Google Scholar]
- Moss, D. 2004, MNRAS, 352, L17 [NASA ADS] [CrossRef] [Google Scholar]
- Moss, D., & Brooke, J. 2000, MNRAS, 315, 521 [NASA ADS] [CrossRef] [Google Scholar]
- Moss, D., & Sokoloff, D. 2007, MNRAS, 377, 1597 [NASA ADS] [CrossRef] [Google Scholar]
- Moss, D., Piskunov, N., & Sokoloff, D. 2002, A&A, 396, 885 [NASA ADS] [CrossRef] [EDP Sciences] [Google Scholar]
- Moss, D., Sokoloff, D., Kuzanyan, K., & Petrov, A. 2004, Geophys. Astrophys. Fluid Dyn., 98, 257 [NASA ADS] [CrossRef] [Google Scholar]
- Noyes, R. W., Hartmann, L. W., Baliunas, S. L., Duncan, D. K., & Vaughan, A. H. 1984a, ApJ, 279, 763 [NASA ADS] [CrossRef] [Google Scholar]
- Noyes, R. W., Weiss, N. O., & Vaughan, A. H. 1984b, ApJ, 287, 769 [NASA ADS] [CrossRef] [Google Scholar]
- Oláh, K., Kolláth, Z., Granzer, T., et al. 2009, A&A, 501, 703 [NASA ADS] [CrossRef] [EDP Sciences] [Google Scholar]
- Ossendrijver, A. J. H. 1997, A&A, 323, 151 [NASA ADS] [Google Scholar]
- Rüdiger, G., & Brandenburg, A. 1995, A&A, 296, 557 [NASA ADS] [Google Scholar]
- Rüdiger, G., & Hollerbach, R. 2004, The magnetic universe: geophysical and astrophysical dynamo theory (Wiley-VCH) [Google Scholar]
- Rüdiger, G., von Rekowski, B., Donahue, R. A., & Baliunas, S. L. 1998, ApJ, 494, 691 [NASA ADS] [CrossRef] [Google Scholar]
- Rüdiger, G., Elstner, D., & Ossendrijver, M. 2003, A&A, 406, 15 [NASA ADS] [CrossRef] [EDP Sciences] [Google Scholar]
- Schmitt, D. 1987, A&A, 174, 281 [NASA ADS] [Google Scholar]
- Schrijver, C. J., & Title, A. M. 2001, ApJ, 551, 1099 [NASA ADS] [CrossRef] [Google Scholar]
- Strassmeier, K. G. 2009, A&AR, 17, 251 [Google Scholar]
- Subramanian, K., & Brandenburg, A. 2004, PRL, 93, 205001 [Google Scholar]
- Tobias, S. M., Dagon, K., & Marston, J. B. 2011, ApJ, 727, 127 [NASA ADS] [CrossRef] [Google Scholar]
- Vogt, S. S., Hatzes, A. P., Misch, A. A., & Kürster, M. 1999, ApJS, 121, 547 [NASA ADS] [CrossRef] [Google Scholar]
- Wilmot-Smith, A. L., Nandy, D., Hornig, G., & Martens, P. C. H. 2006, ApJ, 652, 696 [NASA ADS] [CrossRef] [Google Scholar]
- Zhang, H., Sakurai, T., Pevtsov, A., et al. 2010, MNRAS, 402, L30 [NASA ADS] [CrossRef] [Google Scholar]
All Tables
A systematization of the cases where polewards migration or other features different from the solar case are deduced to explain observations.
The general features of the solutions with solar-like rotation law. EW, PW, SW denote equatorwards, polewards, standing wave respectively for migration of Bφ in a near-surface layer.
The general features of the solutions with the quasi-cylindrical rotation law. EW, PW denote equatorwards, polewards respectively for Bφ migration in a near-surface layer.
The variety of butterfly diagrams obtained with the intermediate rotation law and the deep convective zone (r0 = 0.2). Some intermediate cases, not tabulated, were also found.
All Figures
|
Fig. 1 Equally spaced isorotation contours for the solar rotation law used (left hand panel) and contours for our quasi-cylindrical law for rapid rotators (right hand panel). |
| In the text | |
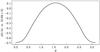 |
Fig. 2 Function |
| In the text | |
|
Fig. 3 The function f1(r) (which determines the radial dependence of the unquenched α-term). Row a), iα = 0,1; row b), iα = 2,3; row c), iα = 6,7. |
| In the text | |
|
Fig. 4 Butterfly diagrams for the sub-surface field. Left hand column has Cα < 0, right hand column has Cα > 0. Rows 1–4 have the quasi-solar rotation law, rows 5 and 6 the quasi-cylindrical law. First row: Models 1 and 19 with iα = 3,m = 4. Second row: Models 6 and 24 with iα = 1,m = 4. Third row: Models 8 and 26 with iα = 0,m = 2. Fourth row: Models 12 and 30 with iα = 1,m = 2. Fifth row: Models 1c and 13c, with iα = 3,m = 2. Bottom row: Models 7c and 19c, with iα = 3,m = 4. |
| In the text | |
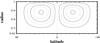 |
Fig. 5 Streamlines of the circulation defined by (6). With Rm > 0 the surface flow is polewards. |
| In the text | |
|
Fig. 6 Butterfly diagrams for Model 26 (solar rotation, Cα > 0,iα = 0,m = 2): top – without meridional circulation (Rm = 0), bottom of the convection zone; middle – Rm = 20, sub-surface; bottom – Rm = 20, bottom of the convection zone. Solid/broken contours denote positive/negative values of Bφ respectively. |
| In the text | |
|
Fig. 7 Synthetic rotation curve from combining solar-like and quasi-cylindrical rotation laws with 50% weighting. |
| In the text | |
|
Fig. 8 Butterfly diagrams for the synthetic rotation law (combination of solar-like and quasi-cylindrical): top panel – shallow, lower panel – deep parts of the convective zone. |
| In the text | |
|
Fig. 9 Dependence of α on radius at θ = π/4 for the case where α changes sign with radius. |
| In the text | |
|
Fig. 10 Butterfly diagrams resembling that of HR 1099 for a deep convective zone with a change of sign for α (Fig. 9), quasi-cylindrical rotation, iα = 0: sub-surface (upper panel) and deep (bottom panel). |
| In the text | |
Current usage metrics show cumulative count of Article Views (full-text article views including HTML views, PDF and ePub downloads, according to the available data) and Abstracts Views on Vision4Press platform.
Data correspond to usage on the plateform after 2015. The current usage metrics is available 48-96 hours after online publication and is updated daily on week days.
Initial download of the metrics may take a while.