Fig. 6
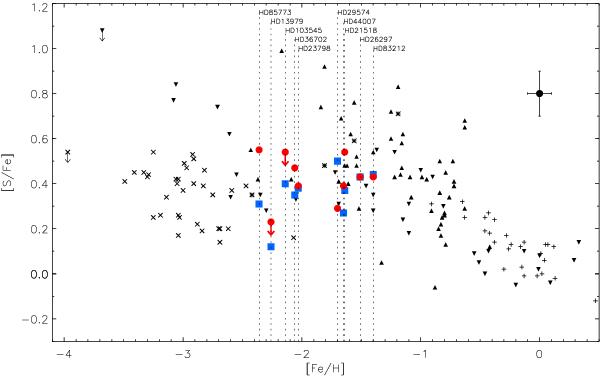
[S/Fe] versus [Fe/H] for the values deduced from the [S i] line shown with red circles and the non-LTE corrected values deduced from the 1045 nm triplet shown with blue squares. Typical uncertainties based on quadratic addition of the values in Table 7 are shown in the upper right hand corner. The plus signs are measurements from Chen et al. (2002), upward pointing triangles from Caffau et al. (2005), asterisks from Caffau et al. (2010), downward pointing triangles from Takeda & Takada-Hidai (2011), and exes from Spite et al. (2011). They are all shifted to log ϵ(S)⊙ = 7.12 (Asplund et al. 2009).
Current usage metrics show cumulative count of Article Views (full-text article views including HTML views, PDF and ePub downloads, according to the available data) and Abstracts Views on Vision4Press platform.
Data correspond to usage on the plateform after 2015. The current usage metrics is available 48-96 hours after online publication and is updated daily on week days.
Initial download of the metrics may take a while.