| Issue |
A&A
Volume 529, May 2011
|
|
|---|---|---|
| Article Number | A126 | |
| Number of page(s) | 5 | |
| Section | Extragalactic astronomy | |
| DOI | https://doi.org/10.1051/0004-6361/201016388 | |
| Published online | 15 April 2011 | |
Emission lines in early-type galaxies: active nuclei or stars?
1
INAF – Osservatorio Astronomico di Torino, via Osservatorio 20, 10025 Pino Torinese Italy
2
Space Telescope Science Institute, 3700 San Martin Drive, Baltimore, MD 21218, USA
e-mail: capetti@oato.inaf.it; baldi@stsci.edu
Received: 22 December 2010
Accepted: 28 February 2011
We selected 27 244 nearby, red, giant early-type galaxies (RGEs) from the Sloan Digital Sky Survey (SDSS). In a large fraction (53%) of their spectra the [O III]λ5007 emission line is detected, with an equivalent width (EW) distribution strongly clustered around ~0.75 Å. The vast majority of those RGEs for which it is possible to derive emission line ratios (amounting to about half of the sample) show values characteristic of LINERs. The close connection between emission lines and stellar continuum points to stellar processes as the most likely source of the bulk of the ionizing photons in RGEs, rather than active nuclei. In particular, the observed EW and optical line ratios are consistent with the predictions of models in which the photoionization comes from hot evolved stars. Shocks driven by supernovae or stellar ejecta might also contribute to the ionization budget. A minority, ~4%, of the galaxies show emission lines with an equivalent width that is a factor of ≳2 greater than the sample median. Only among them are Seyfert-like spectra found. Furthermore, 40% of this subgroup have a radio counterpart, compared to ~6% of the rest of the sample. These characteristics argue in favor of an AGN origin for their emission lines. Emission lines diagnostic diagrams do not reveal a distinction between the AGN subset and the other members of the sample, and consequently they are not a useful tool for establishing the dominant source of the ionizing photons, which is better predicted by the EW of the emission lines.
Key words: galaxies: active / galaxies: elliptical and lenticular, cD / galaxies: ISM
© ESO, 2011
1. Introduction
The presence of ionized gas in early-type galaxies, part of a complex multiphase interstellar medium (ISM), has now been firmly established. Among other issues, the source of ionization that powers the observed emission lines is still a matter of debate. Several alternatives have been advanced, ascribing it to active galactic nuclei (AGN), to hot evolved stars, and to shocks (e.g. Heckman 1980; Binette et al. 1994; Dopita & Sutherland 1995). A better understanding of this phenomenon is important for several reasons, e.g. in the contexts of the origin and evolution of early-type galaxies and of their ISM and of a correct census and demography of active galaxies.
In this paper we explore this issue by studying a homogeneous sample of galaxies, restricted to a rather narrow range of galaxy properties. We isolated nearby, quiescent (from the point of view of star formation), massive early-type galaxies from the SDSS (York et al. 2000). More specifically, from the main sample of ~800 000 galaxies with spectra available from the SDSS, Data Release (DR) 7, we used the MPA-JHU DR7 release of spectrum measurements, available at http://www.mpa-garching.mpg.de/SDSS/DR7/, to select all sources with the following spectroscopic criteria: 1) redshift between 0.01 and 0.1; 2) Ca break strength Dn(4000) > 1.7; and 3) stellar velocity dispersion σ∗ > 156 km s-1. If adopting the scaling relation between mass and velocity dispersion this corresponds to galaxies with M∗ ≳ 5 × 10¹⁰ M⊙, (Hyde & Bernardi 2009). We only retain early-type galaxies, i.e. objects with a concentration index (the ratio of the radii including 90% and 50% of the r band light) Cr ≥ 2.86 (Nakamura et al. 2003; Shen et al. 2003). This selection yields 27 244 red, giant, early-type galaxies (hereafter RGEs).
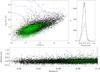 |
Fig. 1 Left panel: logarithm of the [O III] emission line flux (in units of 10-17 erg s-1 cm-2) versus the k-corrected i band magnitude within the SDSS fiber, both quantities corrected for galactic absorption. Green dots mark upper limits in line flux. The dashed red line corresponds to a constant ratio between the two quantities. Contours (blue for the objects with an [O III] detection, yellow for upper limits) represent the iso-densities of DR7 galaxies in the same redshift range; levels are in geometric sequence with a common ratio of 4. Right panel: histogram of the residuals from the median line. The dashed histogram is the contribution of upper limits. The dispersion of the distribution is 0.18 dex. Bottom: residuals from the median vs. redshift. |
2. Emission lines and stellar continuum
We considered the [O III]λ5007 emission line flux measured after subtracting a starlight template (see Kauffmann et al. 2003, for a detailed description of the method used for the continuum subtraction). The [O III] line is detected at a significance higher than 3σ in ~53% of RGEs of the sample. Figure 1 compares the [O III] flux with the k-corrected i band magnitude within the SDSS fiber, with both quantities corrected for galactic absorption. A strong connection emerges, and the vast majority of the objects are clustered in a narrow stripe. We used the algorithms proposed by Dempster et al. (1977) and Buckley & James (1979), implemented as emmethod and buckleyjames in IRAF, to deal with censored data in order to derive the best-fitting logarithmic slope of the F [O III] versus i relation. The resulting values are 0.41 ± 0.01 and 0.40 ± 0.01, respectively, both consistent with a constant ratio between emission line and stellar continuum.
In the right panel we show the histogram of the residuals from the median line that is reproduced well by a Gaussian distribution with a dispersion of only 0.18 dex (similar results, although with slightly broader distributions, are obtained using different lines and/or continuum bands). Nonetheless, there are outliers with a line excess, R [O III] 1, of up to 100. Setting a threshold at R [O III] = 5, we find 0.5% outliers, a fraction that increases to 1.2% (3.5%) when lowering the limit to 3 (2).
The EW of the [O III] line, estimated by considering the continuum level 200 pixels around the line, has a median value of ~0.75 Å including upper limits in the analysis) and the EW dispersion is of 0.20 dex; 95% of RGEs with an [O III] detection have 0.3 < EW < 1.7 Å.
Contours in Fig. 1 represent the iso-densities of the ~340 000 DR7 galaxies in the same redshift range, 0.01 < z < 0.1, but without any further selection of the spectro-photometric properties. The general galaxies population shows a concentration in the same locus as covered by the RGEs, but also a substantial population extending toward high line excesses (~30% of the sample has an excess of R [O III] > 3).
We looked for trends between the residuals and the spectrophotometric parameters used for the sample selection (namely redshift, Dn(4000), concentration index, and velocity dispersion), but we failed to find any statistically significant link. In particular, there are no differences between RGEs at low and high redshifts: the best linear fit of the residuals against redshift indicates that objects at z = 0.01 have a ratio between line and continuum only (20 ± 11)% higher than those at z = 0.1.
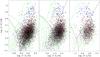 |
Fig. 2 Spectroscopic diagnostic diagrams for RGEs. The solid lines are from Kewley et al. (2006) and separate star-forming galaxies, LINER, and Seyfert; in the first panel the region between the two curves is populated by the composite galaxies. Blue dots mark the “strong” outliers (objects with a line excess with respect to the median value R [O III] > 5) in Fig. 1, and red dots the “weak” outliers (3 < R [O III] < 5). Contours represent the iso-densities of all DR7 emission line galaxies. |
3. Spectroscopic diagnostic diagrams
Figure 2 shows the location in the spectroscopic diagnostic diagrams (e.g. Heckman 1980; Baldwin et al. 1981; Veilleux & Osterbrock 1987; Kewley et al. 2006) for the RGEs that have all the relevant emission lines detected at SNR > 3 separately for each diagram. Starting from the left side, the percentages with respect to the whole sample are of 29, 23, and 8% in the three diagrams, respectively. The vast majority of the objects fall in the LINERs region, while the Seyfert and star-forming regions are scarcely populated.
Considering the properties of outliers first, “strong” outliers (i.e. the objects with R [O III] > 5) represent essentially all of the Seyferts; nonetheless, most of them are LINERs. “Weak” outliers (with 3 < R [O III] < 5) do not differ significantly, on the one hand, from the “stronger” ones (but there are fewer Seyfert among them), but on the other, they cannot be readily separated from the bulk of the RGEs population.
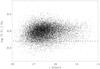 |
Fig. 3 [N II]/Hα ratio for all sources with both lines detected. Emission lines of the objects above the horizontal dashed line are unlikely to be powered by star formation. |
We now turn our attention to the objects that have no optical classification because at least one of the key emission lines is undetected. This subsample is clearly very important, because it is composed of ~3/4 of the galaxies. Nonetheless, [N II] and Hα are both detected in ~50% of the galaxies and this allows us to derive at least a tentative classification. In fact, log([N II]/Hα) > −0.3 in 90% of them (see Fig. 3), a threshold above which no star-forming galaxies are found. On the other hand, Seyfert galaxies usually have bright emission lines, thence they are expected to be all properly cataloged by the diagnostic diagrams in Fig. 2. This leads to the conclusion that these galaxies, amounting to about half of the RGEs, are generally LINERs.
4. Error budget of the emission line fluxes
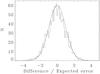 |
Fig. 4 Difference between pairs of duplicated [O III] flux measurements divided by the error estimated propagating the individual uncertainties. The solid line is a Gaussian distribution with a dispersion of 1. |
Since we are studying emission lines generally of very low EW, it is important to assess the reliability of such measurements and of the error estimates. Two sources of uncertainties should be considered, the first related to statistical errors, the second to the effects of starlight modeling.
We deal with statistical uncertainties by studying the galaxies with multiple SDSS spectroscopic observations. There are 3103 such objects: 45% of them have the [O III] line detected in both datasets, 35% are upper limits in both observations, while 20% change from detected to undetected (or vice versa). Considering the objects detected in both observations, the differences between the independent measurements closely follow a Gaussian distribution with a dispersion equal to what is expected based on the uncertainties in each flux estimate (see Fig. 4). We conclude that the error assessment is robust and that most (85%) of the [O III] detections are confirmed by multiple observations.
In addition to the statistical uncertainties, we must also consider the effects related to the accuracy of the subtraction of the stellar emission. As discussed in detail by Annibali et al. (2010), because of the degeneracy between age, metallicity, and extinction, fits to the continuum emission of similarly good quality can produce significantly different residual spectra. This is particular relevant for the Hβ line (and to a lesser extent for Hα) which is superimposed on the stellar Balmer absorption feature. The method proposed by Annibali et al. (2010) to cope with this problem in their study of a sample of nearby ETG is to explore the changes in the emission lines fluxes related to the various stellar templates, limiting it to those that yield a fit with χ2 < 2. The adopted emission line flux is a weighted average of those derived from all acceptable fits, while its error is a weighted value of the dispersion between the individual estimates.
The very large number of SDSS objects considered prevents a detailed analysis of the error budget considered by these authors. However, this provides us with guidance on the typical uncertainties that should be associated with the line measurements due to a template mismatch. From their published values for their smaller synthetic aperture (comparable in size with the SDSS fiber), we estimated that the median errors in the EW for Hβ, [O III], and Hα are 0.16, 0.08, and 0.08 Å, respectively. We adopt these reference values also for the SDSS sources. The errors in EW have been been converted into a line flux error and then added quadratically to the uncertainties provided by the SDSS database.
Our results for the connection between [O III] flux and z magnitude are only marginally changed by adopting this more conservative error treatment. The fraction of detected sources decreases from 53 to 50%, but the slope of the relation remains unchanged. The number of outliers is not affected.
We then reconsidered the diagnostic diagrams, excluding all sources that do not meet the 3σ criterion with the revised errors. The fraction of sources in the various diagrams decreases by 25 to 40%, but their visual appearance is essentially preserved. In order to quantify more subtle differences, we estimated the changes of median values and dispersions of the various ratios. Not surprisingly log [O III] /Hβ is the more affected ratio, because it changes from 0.15 (with an rms of 0.20) to 0.09, (rms = 0.18 dex). This is most likely due to the preferred exclusion of galaxies with low Hβ EW. Nonetheless, the result that the vast majority of the sources are LINERs is confirmed.
Finally, we explored how crucial the precise value of the adopted errors on EW is. Doubling the reference values, the number of sources in the diagnostic diagrams keeps decreasing, but their location is effectively unchanged, with a median of log [O III] /Hβ = 0.05.
5. Discussion
Most nearby, red, giant early-type galaxies are emission line galaxies. In particular, in 53% of their SDSS spectra, the [O III]λ5007 line is detected. The majority of the objects for which this analysis was possible show emission line ratios characteristic of LINERs.
The [O III] flux shows a strong correlation with the flux measured within the 3″ SDSS fiber in the i band. The i band magnitude (being less affected by uncertainties in the k-correction, absorption, and by differences in the stellar population) is a good estimator of the stellar mass within the fiber. Thus the ratio between lines and stellar mass is essentially constant (showing a dispersion of only 0.18 dex) while both quantities vary by a factor of ~30. Furthermore, there is only a marginal trend for a change of EW with redshift: objects at z = 0.01 have a ratio between line and continuum (20 ± 11)% higher than those at z = 0.1 despite the change in the size of the region covered by the SDSS fiber from ~0.6 to 5.5 kpc.
These two results are not straightforward for explaining if the emission lines are powered by an AGN. In fact, they require a fine tuning between the strength of the nuclear ionizing field, the spatial distribution of the emission lines, and the stellar mass. A general link between AGN activity and the total stellar mass can be envisaged, via the constant ratio between the mass of stars and of the black hole (Marconi & Hunt 2003), while we find a connection with the stellar mass covered by the SDSS fiber. Furthermore, also the accretion rate, the second parameter that together with the black hole mass sets the radiative output of the AGN, should be closely linked with the amount of stars within the central 3″ of each given galaxy.
Conversely, these findings strongly suggest that processes related to the stellar population are at the origin of the observed emission lines.
As argued by several authors (e.g. Binette et al. 1994; Macchetto et al. 1996; Stasińska et al. 2008; Sarzi et al. 2010), hot evolved stars, such as post-asymptotic giant branch stars (pAGB) and white dwarves (WD), can produce a substantial diffuse field of ionizing photons. More quantitatively, the observed median EW for Hα in the sample considered here is EWHα ~ 0.8 Å, well within the range 0.6 − 1.7 Å predicted by Binette et al. (1994) for a stellar population of age ~1010 years, assuming that the cold gas intercepts all the ionizing photons. Stasińska et al. (2008) have explored photoionization models in which the Lyman continuum radiation is directly estimated from a stellar population analysis, and find that, by varying the metallicity and ionization parameter U, the resulting emission line ratios cover the whole region typical of LINERs in the spectroscopic diagnostic diagrams. In particular, the location of RGEs is reproduced well by models with 0.5 ≲ Z∗ / Z⊙ ≲ 2 and log U ~ −3.7.
Shocks can represent an additional source of ionization. It has been shown by, e.g., Allen et al. (2008) that they can produce emission lines with ratios mimicking those of active nuclei and of LINERs, in particular. The connection between stellar mass and emission line flux suggests that such shocks must be driven by the stellar population, as in the case of supernovae or of stellar ejecta, rather than by bars of triaxial perturbations.
We conclude that the properties of emission lines in RGEs can in general be satisfactorily accounted for by photoionization related to hot evolved stars or by shocks driven by the stellar processes (but below we discuss the few and important exceptions of likely AGN dominated objects). The narrow spread of observed EW, very difficult to explain in an AGN framework, set strong constraints even when adopting a “stellar” interpretation. For example, in the scenario of lines powered by an evolved stellar population, the apparently stringent requirement that the cold gas must intercept essentially all of the ionizing photons, becomes probably instrumental in producing a narrow distribution of lines EW. In fact this effectively removes the fundamental degree of freedom related to the ISM optical depth to ionizing photons. The selection of galaxies within a rather narrow range of the various spectro-photometric parameters space is also a key ingredient in reducing the scatter between F [O III] and i magnitude (see Fig. 1).
These results were obtained by focusing on RGEs, but the consequences are probably more far reaching. In fact, in the F [O III] vs. i plane a strong concentration is also seen for the general population of galaxies, in the same region covered by RGEs. This suggests a wider application, possibly extending to less massive early-type galaxies and to the bulges of spiral galaxies.
Nonetheless, there are outliers from the general link between stellar and line emission. Only among these sources we found Seyfert-like spectra. Furthermore, a strong connection emerges between the excess in line emission and the presence of a nuclear radio source, a characteristic signature of an AGN. Our selection criteria isolate galaxies whose properties are closely matched to the typical hosts of low-luminosity radio-loud AGN (Baldi & Capetti 2010). Considering the outliers with R [O III] > 5 (3), 49% (45%) have a radio counterpart in the FIRST2 catalog within 2″ from the optical position. In the rest of the sample, only 6% of the sources have a radio counterpart. The connection between outliers and radiosources is preserved even at very small line excesses, since 31% of those with 2 < R [O III] < 3 and 17% of the objects with an excess by only a factor of 1.5 to 2, are associated with a FIRST source. Thus, the galaxies that exceed the rather narrow range of line emission EW set by the stellar processes are very often associated with an active nucleus. The observed line excess is likely to stem from the additional source of ionizing photons represented by the AGN. The rather loose relation between radio power and line luminosity seen in these low-luminosity AGN (see the results presented by Baldi & Capetti 2010) might explain the incomplete coincidence between line excess and the presence of a radio source and, on the other hand, the reason not all radio sources produce a detectable increase in the line EW.
Apparently, the location in the spectroscopic diagnostic diagrams is not sufficient to establish the dominant source of ionizing photons, which, conversely, is best predicted by the EW of the emission lines. In fact, the likely AGN show line ratios that
are essentially indistinguishable (leaving aside the few Seyfert-like objects) from those probably dominated by stellar processes. As already pointed out by Stasińska et al. (2008), this has important ramifications where the census and the properties of AGN are concerned. To isolate and explore the properties of genuine low-luminosity active galaxies, spectroscopic observations obtained with a smaller aperture are needed to increase the contrast between AGN and stellar induced line emission.
Faint Images of the Radio Sky at Twenty centimeters survey (Becker et al. 1995).
Acknowledgments
We thank David J. Axon and the anonymous referee for comments that improved the clarity of this paper.
References
- Allen, M. G., Groves, B. A., Dopita, M. A., Sutherland, R. S., & Kewley, L. J. 2008, ApJS, 178, 20 [Google Scholar]
- Annibali, F., Bressan, A., Rampazzo, R., et al. 2010, A&A, 519, A40 [NASA ADS] [CrossRef] [EDP Sciences] [Google Scholar]
- Baldi, R. D., & Capetti, A. 2010, A&A, 519, A48 [NASA ADS] [CrossRef] [EDP Sciences] [Google Scholar]
- Baldwin, J. A., Phillips, M. M., & Terlevich, R. 1981, PASP, 93, 5 [NASA ADS] [CrossRef] [EDP Sciences] [Google Scholar]
- Becker, R. H., White, R. L., & Helfand, D. J. 1995, ApJ, 450, 559 [NASA ADS] [CrossRef] [Google Scholar]
- Binette, L., Magris, C. G., Stasińska, G., & Bruzual, A. G. 1994, A&A, 292, 13 [NASA ADS] [Google Scholar]
- Buckley, J., & James, I. 1979, Biometrika, 66, 429 [CrossRef] [Google Scholar]
- Dempster, A. P., Laird, M., & Rubin, A. 1977, J. Royal Statist. Soc., 39, 1 [Google Scholar]
- Dopita, M. A., & Sutherland, R. S. 1995, ApJ, 455, 468 [NASA ADS] [CrossRef] [Google Scholar]
- Heckman, T. M. 1980, A&A, 87, 152 [NASA ADS] [Google Scholar]
- Hyde, J. B., & Bernardi, M. 2009, MNRAS, 394, 1978 [NASA ADS] [CrossRef] [Google Scholar]
- Kauffmann, G., Heckman, T. M., White, S. D. M., et al. 2003, MNRAS, 341, 33 [NASA ADS] [CrossRef] [Google Scholar]
- Kewley, L. J., Groves, B., Kauffmann, G., & Heckman, T. 2006, MNRAS, 372, 961 [NASA ADS] [CrossRef] [Google Scholar]
- Macchetto, F., Pastoriza, M., Caon, N., et al. 1996, A&AS, 120, 463 [NASA ADS] [CrossRef] [EDP Sciences] [Google Scholar]
- Marconi, A., & Hunt, L. K. 2003, ApJ, 589, L21 [NASA ADS] [CrossRef] [Google Scholar]
- Nakamura, O., Fukugita, M., Yasuda, N., et al. 2003, AJ, 125, 1682 [NASA ADS] [CrossRef] [Google Scholar]
- Sarzi, M., Shields, J. C., Schawinski, K., et al. 2010, MNRAS, 402, 2187 [NASA ADS] [CrossRef] [Google Scholar]
- Shen, S., Mo, H. J., White, S. D. M., et al. 2003, MNRAS, 343, 978 [NASA ADS] [CrossRef] [Google Scholar]
- Stasińska, G., Vale Asari, N., Cid Fernandes, R., et al. 2008, MNRAS, 391, L29 [NASA ADS] [Google Scholar]
- Veilleux, S., & Osterbrock, D. E. 1987, ApJS, 63, 295 [NASA ADS] [CrossRef] [Google Scholar]
- York, D. G., Adelman, J., Anderson, Jr., J. E., et al. 2000, AJ, 120, 1579 [Google Scholar]
All Figures
|
Fig. 1 Left panel: logarithm of the [O III] emission line flux (in units of 10-17 erg s-1 cm-2) versus the k-corrected i band magnitude within the SDSS fiber, both quantities corrected for galactic absorption. Green dots mark upper limits in line flux. The dashed red line corresponds to a constant ratio between the two quantities. Contours (blue for the objects with an [O III] detection, yellow for upper limits) represent the iso-densities of DR7 galaxies in the same redshift range; levels are in geometric sequence with a common ratio of 4. Right panel: histogram of the residuals from the median line. The dashed histogram is the contribution of upper limits. The dispersion of the distribution is 0.18 dex. Bottom: residuals from the median vs. redshift. |
| In the text | |
|
Fig. 2 Spectroscopic diagnostic diagrams for RGEs. The solid lines are from Kewley et al. (2006) and separate star-forming galaxies, LINER, and Seyfert; in the first panel the region between the two curves is populated by the composite galaxies. Blue dots mark the “strong” outliers (objects with a line excess with respect to the median value R [O III] > 5) in Fig. 1, and red dots the “weak” outliers (3 < R [O III] < 5). Contours represent the iso-densities of all DR7 emission line galaxies. |
| In the text | |
|
Fig. 3 [N II]/Hα ratio for all sources with both lines detected. Emission lines of the objects above the horizontal dashed line are unlikely to be powered by star formation. |
| In the text | |
|
Fig. 4 Difference between pairs of duplicated [O III] flux measurements divided by the error estimated propagating the individual uncertainties. The solid line is a Gaussian distribution with a dispersion of 1. |
| In the text | |
Current usage metrics show cumulative count of Article Views (full-text article views including HTML views, PDF and ePub downloads, according to the available data) and Abstracts Views on Vision4Press platform.
Data correspond to usage on the plateform after 2015. The current usage metrics is available 48-96 hours after online publication and is updated daily on week days.
Initial download of the metrics may take a while.