Fig. 1
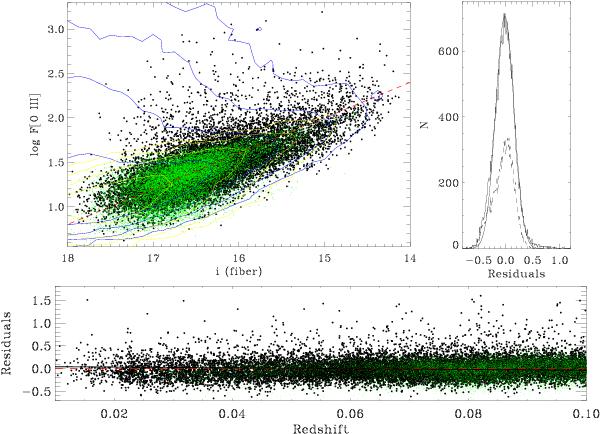
Left panel: logarithm of the [O III] emission line flux (in units of 10-17 erg s-1 cm-2) versus the k-corrected i band magnitude within the SDSS fiber, both quantities corrected for galactic absorption. Green dots mark upper limits in line flux. The dashed red line corresponds to a constant ratio between the two quantities. Contours (blue for the objects with an [O III] detection, yellow for upper limits) represent the iso-densities of DR7 galaxies in the same redshift range; levels are in geometric sequence with a common ratio of 4. Right panel: histogram of the residuals from the median line. The dashed histogram is the contribution of upper limits. The dispersion of the distribution is 0.18 dex. Bottom: residuals from the median vs. redshift.
Current usage metrics show cumulative count of Article Views (full-text article views including HTML views, PDF and ePub downloads, according to the available data) and Abstracts Views on Vision4Press platform.
Data correspond to usage on the plateform after 2015. The current usage metrics is available 48-96 hours after online publication and is updated daily on week days.
Initial download of the metrics may take a while.