Fig. 2
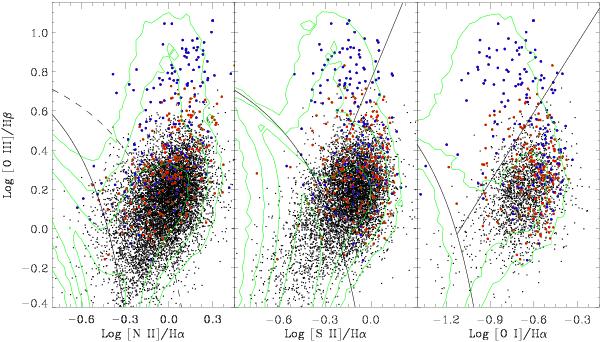
Spectroscopic diagnostic diagrams for RGEs. The solid lines are from Kewley et al. (2006) and separate star-forming galaxies, LINER, and Seyfert; in the first panel the region between the two curves is populated by the composite galaxies. Blue dots mark the “strong” outliers (objects with a line excess with respect to the median value R [O III] > 5) in Fig. 1, and red dots the “weak” outliers (3 < R [O III] < 5). Contours represent the iso-densities of all DR7 emission line galaxies.
Current usage metrics show cumulative count of Article Views (full-text article views including HTML views, PDF and ePub downloads, according to the available data) and Abstracts Views on Vision4Press platform.
Data correspond to usage on the plateform after 2015. The current usage metrics is available 48-96 hours after online publication and is updated daily on week days.
Initial download of the metrics may take a while.