| Issue |
A&A
Volume 529, May 2011
|
|
|---|---|---|
| Article Number | A43 | |
| Number of page(s) | 10 | |
| Section | Interstellar and circumstellar matter | |
| DOI | https://doi.org/10.1051/0004-6361/201016361 | |
| Published online | 29 March 2011 | |
The evolution of M 2–9 from 2000 to 2010⋆,⋆⋆
1
Instituto de Astrofísica de Canarias, 38200 La Laguna, Tenerife, Spain
e-mail: This email address is being protected from spambots. You need JavaScript enabled to view it.
2
Departamento de Astrofísica, Universidad de La Laguna, 38206 La Laguna, Tenerife, Spain
3
Astronomy Department, University of Washington, Seattle, WA 98195, USA
4
Isaac Newton Group of Telescopes, Apart. de Correos 321, 38700 Santa Cruz de la Palma, Spain
Received: 20 December 2010
Accepted: 4 February 2011
Abstract
Context. Understanding the formation of collimated outflows is one of the most debated and controversial topics in the study of the late stages of stellar evolution.
Aims. M 2–9 is an outstanding representative of extreme aspherical flows. It presents unique features such as a pair of high-velocity dusty polar blobs and a mirror-symmetric rotating pattern in the inner lobes. Their study provides important information on the nature of the poorly understood central source of M 2–9 and its nebula.
Methods. Imaging monitoring at sub-arcsec resolution of the evolution of the nebula in the past decade is presented. Spectroscopic data provide complementary information.
Results. We determine the proper motions of the dusty blobs, which infer a new distance estimate of 1.3 ± 0.2 kpc, a total nebular size of 0.8 pc, a speed of 147 km s-1, and a kinematical age of 2500 yr. The corkscrew geometry of the inner rotating pattern is confirmed and quantified. Different recombination timescales for different ions explain the observed surface brightness distribution. According to the images taken after 1999, the pattern rotates with a period of 92 ± 4 years. On the other hand, the analysis of images taken between 1952 and 1977 measures a faster angular velocity. If the phenomenon were related to orbital motion, this would correspond to a modest orbital eccentricity (e = 0.10 ± 0.05), and a slightly shorter period (86 ± 5 years). New features have appeared after 2005 on the west side of the lobes and at the base of the pattern.
Conclusions. The geometry and travelling times of the rotating pattern support our previous proposal that the phenomenon is produced by a collimated spray of high velocity particles (jet) from the central source, which excites the walls of the inner cavity of M 2–9, rather than by a ionizing photon beam. The speed of such a jet would be remarkable: between 11 000 and 16 000 km s-1. The rotating-jet scenario may explain the formation and excitation of most of the features observed in the inner nebula, with no need for additional mechanisms, winds, or ionization sources. All properties point to a symbiotic-like interacting binary as the central source of M 2–9. The new distance determination implies system parameters that are consistent with this hypothesis.
Key words: planetary nebulae: individual: M 2–9 / ISM: jets and outflows / stars: winds, outflows / binaries: symbiotic
Based on observations obtained at; the 2.6 Nordic Optical Telescope operated by NOTSA; the 2.5 m INT and 4.2 m WHT telescopes of the Isaac Newton Group of Telescopes in the Spanish Observatorio del Roque de Los Muchachos of the Instituto de Astrofísica de Canarias. Also based on observations made with the NASA/ESA Hubble Space Telescope, obtained at the Space Telescope Science Institute, which is operated by the Association of Universities for Research in Astronomy, Inc., under NASA contract NAS 5-26555. These observations are associated with programs 8773 and 9050.
Movie is only available in electronic form at http://www.aanda.org
© ESO, 2011
1. Introduction
M 2–9, also known as the “Butterfly” or the “Twin Jet” nebula, is a bright bipolar nebula of uncertain nature. It is included in the general list of Galactic planetary nebulae as PN G010.8+18.0 (Acker et al. 1992), and is often considered to be a young planetary nebula. However, the spectrum of its nebular nucleus (Balick 1989) and the rotating pattern in the inner lobes (e.g. Livio & Soker 2001) made several authors suggest that M 2–9 contains a symbiotic star at its centre. 5 supported this classification based on infrared colours typical of symbiotic Miras; however, several authors have pointed out that these colours can also be produced by dusty discs (Chesneau et al. 2007; Cohen et al. 2011; Lykou et al. 2011).
Figure 1 illustrates the morphology of M 2–9. The image is a composition of short and deep Hα+[N ii] exposures (see Table 1): the 2009 image from the NOT telescope is used to display the inner regions of the nebula (inset picture), and the outer faint regions are from the 2006 INT image. The object is extraordinary in several aspects. At large distances from the nucleus along the main axis of the nebula, faint outer lobes with a point-symmetric surface-brightness distribution are observed. They culminate in high-velocity dust blobs that scatter and absorb the illuminating light like a pair of fog clouds receding in opposite directions from a streetlight, as shown by 6. A space velocity of the dusty blobs of 164 km s-1, a total separation of 0.4 pc, and an age of 1200 yr were determined by 6 for the adopted distance of 650 pc (twice as short as derived in this paper). But the outstanding characteristic of M 2–9 is undoubtedly its moving pattern in the inner lobes (features S1, S2, N1 and N2), rotating like in a lighthouse with a period of about a century (Aller & Swings 1972; Kohoutek & Surdej 1980; Doyle et al. 2000). No other similar objects are known in the sky, with the possible exception of η Carinae, where azimuthal illumination variability might also occur (Smith et al. 2004). However, in η Car the phenomenon is far less clear and regular than in M 2–9.
The nebula of M 2–9 is oriented in the sky at position angle 358° and is seen close to edge-on: an inclination of its symmetry axis on the plane of sky of 11° (Goodrich 1991), 15° (Schwarz et al. 1997), and 17° (Solf 2000) was determined. A detailed study of the kinematics of the nebula is presented in 8.
In this article, we present new images monitoring the rotation of the pattern in the past decade. They also allow us to measure the separation rate of the outer blobs, which in turn allows the distance to M 2–9 to be determined via a straightforward geometrical method. This information provides new constraints on the origin of the phenomena observed in M 2–9.
2. Observations
2.1. Images
The images of M 2–9 obtained before 2000 are presented and discussed in 2. Since then, imaging monitoring at sub-arcsec resolution has continued mostly at the 2.6 m Nordic Optical Telescope (NOT) on La Palma, with a deep image also being taken at the 2.5 m Isaac Newton Telescope (INT). At the NOT, the ALFOSC instrument was used, providing a spatial scale of 0 19 per pixel. At the INT, we used the prime focus Wide Field Camera, which has 033 pixels.
HST WFPC2 [O iii] and [N ii] images of the nebula were obtained on June 2001 (proposal ID 8773) and September 2001 (proposal ID 9050). The latter ones were taken with the nebula centred on the PC1 detector, using a four-point dithering sequence and by carefully avoiding saturation of the core of M 2–9, allowing the maximum spatial resolution of HST to be obtained for the study of the innermost regions of the nebula.
Details of the observations, including the central wavelength λc and full width at half maximum (FWHM) of the filters used, exposure times and seeing, are given in Table 1. We note that at both the NOT and the INT the Hα images include emission from the nearby [N ii] doublet, whose contribution is significant throughout the nebula.
 |
Fig. 1 Composition of Hα+[N ii] images of M 2–9 with the identification of features discussed throughout this paper. Where possible, we have tried to maintain the nomenclature used by previous authors. North is up and east is left. The field of view (f.o.v.) is 40′′ × 140′′. |
2.2. Spectra
Deep medium-resolution spectra were obtained on April 8, 2006, at the 4.2 m William Herschel Telescope (WHT) on La Palma, using the double-arm long-slit spectrograph ISIS. The slit was positioned along PA = −1° to cover the main knots of the rotating pattern in the inner lobes, as well as the outermost dusty blobs. Slit width was 06. In the ISIS red arm, the R1200R grating was used, providing a spectral coverage from 6330 Å to 7360 Å, a reciprocal dispersion of 0.22 Å pix-1, and a resolution of 28 km s-1. In the blue arm, the selected grating R1200B provided a spectral coverage between 4465 Å and 5340 Å, a reciprocal dispersion of 0.22 Å pix-1, and a resolution of 32 km s-1. Several red and blue spectra were obtained simultaneously using the standard dichroic of ISIS, with exposure times of 30 s, 400 s × 2, and 1800 s × 3. Seeing was 12 FWHM.
3. Analysis of the motion of the dusty blobs
Schwarz et al. (1997) presented the analysis of the outermost blobs of M 2–9 (S4 and N4 in Fig. 1). These radially opposed features are 60% linearly polarized and both are redshifted with respect to the core, indicating that they are mainly composed of dust and that the radiation from them is reflected light rather than intrinsic emission. The proper motion analysis of the blobs by 6 was based on images taken in the period from 1978 and 1994. While the baseline was significant (16 years), the astrometric calibration was rather uncertain, especially for the first epoch for which the separation of the blobs could not be measured, and was taken as quoted in the original paper by 4. The new deep Hα images obtained on 2002 and 2006 allowed a more precise analysis to be performed. All CCD images in our hands, spanning 18.1 years in the period from 1988 to 2006, were first registered astrometrically using the USNO-B1.0 catalogue (Monet et al. 2003), and then rescaled to a common orthogonal grid with pixel size of 036. In this reference frame, the position of the central source and two nearby reference field stars in the different images show a maximum variation of 01 in right ascension and 02 in declination. These are conservatively taken as the uncertainties in the position of the blobs and the central star. The apparent separation of the blobs was then computed in two ways.
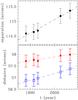 |
Fig. 2 Proper motions of the dusty blobs of M 2–9. Top: the total interblob separation. Bottom: the distance from the central source for each blob separately. Core separation for the north and south blobs is indicated by the filled and empty squares, respectively. Least squares fits are shown by the dashed lines. Positions are computed using the intensity-weighted barycentre. |
3.1. First moment analysis
Our first step was to compute the barycentre of the emission for each blob, defined as the intensity-weighted first moments in a box of fixed size centred on the blob. The total separation of the blobs (Fig. 2, top) is well fitted by a straight line with slope of 0.046 ± 0.004 arcsec yr-1. This is similar to the determination by 6 of 0.051 ± 0.007 arcsec yr-1.
If we consider the motion of each blob separately and measure their separation from the central star (Fig. 2, bottom), a difference seems to emerge with the southern blob moving faster, at a rate of 0.029 ± 0.003 arcsec yr-1 compared to the 0.016 ± 0.003 arcsec yr-1 of the northern one. The difference is however within ~2σ of the errors which, as discussed above, also include the uncertainty associated with the image registration process. We also note in Fig. 2 that the southern blob is more than half an arcsec closer to the central star than the northern one.
3.2. Magnification method
The separation rate of the blobs was also determined by means of the so-called magnification method (see e.g. Balick & Hajian 2004). Basically, the first-epoch image is rescaled using a magnifying factor M until the residuals of the subtraction from a more recent image are minimized. This magnification factor was computed between each pair of subsequent images, as well as by comparing the first-epoch and last-epoch images. The result is that the magnification in the 18.08 years considered is MN = 1.0046 for the northern blob (corresponding to a proper motion of 0.015 arcsec yr-1), and MS = 1.0088 for the southern one (0.028 arcsec yr-1). The uncertainty is of the order of 0.0004 in both cases. These figures fully agree with the separation rates computed from the first moment analysis. The lower accuracy of the latter method is mainly due to the lack of a clear separation of the blobs from the outer lobes. Combined with the variable seeing, this prevents homogeneous definition of the blob boundaries in the different images.
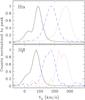 |
Fig. 3 Hα (top) and Hβ (bottom) line profiles for the core of M 2–9 (black solid line), north blob (red dotted line), and south blob (blue dashed lines). Velocities in the abscissae are heliocentric. All profiles have been normalized for easier comparison. Note that local structures in the Hβ profiles of the blobs are not real, but caused by a modest signal-to-noise ratio. |
3.3. Line-of sight velocities
Remembering that the emission of the outermost blobs is scattered light from the central source (Schwarz et al. 1997), their observed redshift is the sum of the velocity of recession of each blob with respect to the central object, Vexp, plus the component of this velocity along the line of sight (see Fig. 5 in Schwarz et al. 1997), according to the formula 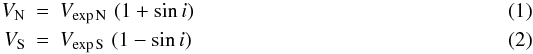 where VN and VS are the redshifts of the light scattered from the blobs as observed in a specific spectral line (e.g. in the strong Hα line produced in the core), and i is the inclination between the plane of the sky and the direction of the blobs’ motion, that we assume to be the same for both blobs and coincident with the long axis of the whole nebula.
Our new deep long-slit spectra allow us to accurately measure VN and VS from both the Hα and Hβ lines. Lines profiles in the core and the blobs are shown in Fig. 3, and the redshifts measured by Gaussian fitting are listed in Table 2. As is well known, the Hα profile in the core of M 2–9 is complex, showing two peaks and extended wings (Balick 1989). This is clearly visible (Fig. 3, top) at the resolution of our spectra (~30 km s-1). For Hβ, the two components are less well-defined, and the line is blue-shifted by 15 km s-1 with respect to Hα in both the core and the lobes (Fig. 3, bottom). This property was investigated by 9, who showed that the trend continues for the higher-level lines of the Balmer series. The effect was modelled by means of 3D radiative transfer in a dense disc with expanding wind velocities slowly increasing with distance from the centre.
For the present discussion, we note the following. First, line profiles measured in the blobs do not have the double-peaked shape shown in the core. This implies that either there is a velocity gradient within the blobs that smooths out the profile emerging from the core, or dust in the blobs sees a different core line profile than we do. For the former hypothesis to be true, we estimate that a velocity dispersion of a few tens of km s-1 within each blob is needed to dilute the two peaks in the blobs’ profile. This however implies that the blobs would disperse significantly (over ~ 10 arcsec for an internal velocity dispersion of 20 km s-1) over their lifetime, unless they are subjected to some constraining mechanism. The latter hypothesis is very appealing, as it would mean that a privileged line of sight from the poles of the nebula with a clear view of the inner source is available from the light reflected by the blobs (as in a dentist’s tilted mirror). Along this direction, the line profile might be simpler owing to a smaller optical thickness of the central disc as seen from the poles. Radiative transfer modelling testing this hypothesis would be valuable. Latitude-dependent Balmer line profiles are also observed in the Homunculus reflection nebula around η Car (Smith et al. 2003).
In any case, that both Hα and Hβ in the core have complex profiles, differently redshifted and morphologically different from those in the blobs, complicates the estimate of the actual redshift of the blobs. For example, subtracting the systemic velocity of the nebula from the observed redshift of each knot could in principle give a wrong estimate of VN and VS in Eqs. (1) and (2). The relevant figure here is the difference in redshift between the core and the blobs profile, which is the direct result of the blob motions. We computed it by shifting the profiles of the blobs in wavelength until the closest match with the core profile was obtained. The values of VN and VS computed in this way are also listed in Table 2. We note the excellent agreement between the figures obtained for Hα and Hβ. They are also in good agreement with the values computed by 6 and 8, although they should be considered more precise given the quality of the data and the more accurate method adopted.
Assuming that the two blobs are moving away from the central star at the same speed, i.e. that Vexp N = Vexp S, an application of Eqs. (1) and (2) yields an inclination i = 18° and a speed of the blobs Vexp = 147 km s-1. This inclination agrees with the value i = 17° found in the kinematical study of 8, which is only slightly larger than the value i = 15° found by 6, and more significantly larger than the former determination of i = 11° by 3. The inclination of M 2–9 was also estimated by fitting inclined circular rings to the parallel lanes visible at intermediate latitudes in the lobes of M 2–9 in the HST [O i] images. This favours an inclination of between 19 and 23 degrees.
However, the analysis of the proper motions seems to indicate that the southern blob is moving twice as fast as the northern blob. If we assume that the ratio of Vexp S to Vexp N is the same as computed from the proper motion analysis (i.e. 1.8), then the inclination resulting from applying Eqs. (1) and (2) with this constraint is as high as 33°, with Vexp N = 124 km s-1 and Vexp S = 224 km s-1. Such a high inclination can be excluded for the large disagreement with all other determinations mentioned earlier. We therefore conclude that the apparent difference in the proper motions between the north and south blob does not reflect a real difference in their speed. We have already mentioned that the difference is, conservatively speaking, within the measurement errors. In addition, at least part of the difference – if true – could be explained by internal motions within the blobs. Another effect that may play a role is that, while Doppler shifts are sensitive to the bulk motion of the blobs, proper motions can reflect pattern motions, as for instance in a shock front associated with these supersonic flows.
3.4. New distance, size, age, and luminosity
Given the considerations at the end of the previous section, to compute the distance of M 2–9 we combined the determination of the true speed of the blobs, 147 km s-1, their inclination, 18°, with the global separation rate of the blobs in the plane of the sky, 0.046 ± 0.004 arcsec yr-1 for their total separation, neglecting possible differences between the two blobs. This gives a distance of 1.3 ± 0.2 kpc. The error includes the possibility that the south blob is indeed moving away from the core at a larger velocity than the north one, which would also imply that the inclination of the nebula is larger than the 18° adopted above (see discussion in the previous section). Our determination is twice the value quoted by 6. While reviewing their computation, we detected an error of a factor of two in the calculation; the additional differences are due to the new proper motion determination.
With a new distance of between 1.1 and 1.5 kpc, the interblob separation would be 0.8 pc, and the kinematical age of the blobs 2500 years. As noted by 7, the blobs would have the same kinematical age as the inner lobes and the central molecular torus (Solf 2000). Therefore, all observed morphological components might have been produced in the same event.
The bolometric luminosity of the system, using the spectral energy distribution as in 6, would be constrained to be between 1600 and 3000 L⊙. This is consistent with the value of 2500 L⊙ in Lykou et al. (2011), and reopens the possibility – compared to the low luminosity estimated in 6 – that the central source in M 2–9 hosts an AGB or luminous post-AGB star.
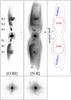 |
Fig. 4 Top: HST [O iii] (left) and [N ii] (centre) images obtained on June 2001, in a logarithmic intensity scale. North is up and east to the left. The f.o.v. of each box is 20′′ × 64′′. At right, a cartoon illustrating the main morphological features of the inner nebula discussed in the text. Bottom: 5′′ × 5′′ blowup of the inner regions (corresponding to the inset boxes in the upper panels), from the dithered HST images obtained on September 2001. |
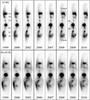 |
Fig. 5 a) Evolution of the rotating pattern of M 2–9 from 1999 to 2010 in the images from the NOT telescope. [O iii] and Hα+[N ii] images are shown in the upper and lower rows, respectively. All images are displayed in a linear intensity scale. North is up and east to the left. The f.o.v. of each box is |

4. The rotating light pattern
4.1. Morphological properties of the features
The HST images in Fig. 4, obtained in 2001, reveal details of the individual features that move inside the inner lobes of M 2–9. While N1, S1, N3, and S3 appear as true knots that retain their shapes – but not their locations – over time, before 2002 N2 and S2 were more clearly described as “arcs”. Within N1 and S1, the [N ii] emission lies closer to the star than the [O iii] emission (Doyle et al. 2000). All these features appear to be located on the walls of cavities within the inner lobes that are reminiscent of “bulbs”. These bulbs, sketched in the right side panel of Fig. 4 and partly recognizable in both the HST [N ii] image and the Hα+[N ii] ground-based images of Fig. 5, stand out better in the higher resolution Hα HST images in Fig. 2 of 2, or in the near-IR image obtained by 7 in the [Fe ii] 16435 Å emission. At the position of the base of N2 and S2, filamentary structures with orthogonal extensions similar to “feathers” appear to depart from the walls of the bulbs along the polar directions.
All structures mentioned so far appear in emission lines from ionized gas. They perhaps represent the ionized inner skin of a thick, (mostly) neutral shell, also indicated in the sketch of Fig. 4, which shines in dust-scattered light as well as in [O i] and H2 emission (Goodrich 1991; Balick 1999; Smith et al. 2005), and forms the outer lobes extending as far as the outermost dusty blobs discussed in Sect. 3. This interpretation of the apparently nested systems of lobes of M 2–9 as the result of an excitation gradient was proposed by 7, and is consistent with the lack of evidence that the various components have different kinematical ages.
In the innermost few arcseconds from the central star (bottom panels of Fig. 4), the [N ii] and [O iii] emission show a faint, diffuse east-west structure that is aligned with infrared dust emission (Lykou et al. 2011). In the vertical direction, the structure is thinnest in [O iii], and near the centre is not resolved at the HST resolution (01, or 130 A.U. at the adopted distance). It then seems to open up on both sides with increasing distance from the central star. In the [N ii] light, the emission is broader. The vertical structure points towards the knots N1 and S1 that were observed at the same time.
4.2. Analysis of the rotation
The NOT images from 1999 to 2010, taken with the same instrument and under similarly good seeing conditions, provide a homogeneous set to analyse the evolution of the rotating pattern in the inner lobes of M 2–9. The sequence of [O iii] and Hα+[N ii] NOT images from 1999 to 2010 is shown in Fig. 5a. A colour animation of the evolution combining images from 1997 to 2010 is available in the electronic version of the paper as Fig. 5b1.
The main characteristics of the rotating pattern are clearly visible in the new sequence of images. The situation was particularly favourable recently, as the rotating features crossed the inner lobes from east to west. With this orientation, the position of the features on the walls of the bulbs is most accurately determined, as is their apparent motion in the plane of the sky, which is the fastest in their “century orbit”. The curvature of the knot trajectories as well as the kinematical study of 8 indicate that the motion has been on the side of the bulbs facing the Earth.
We confirm the fundamental properties of the phenomenon described in 2. N3 and S3 are stationary knots at approximately the tip of the bulbs, but the new [O iii] images show that their detailed morphology changes as the rotating pattern advances westward. The arcs N2/S2 and the knots N1/S1 have instead significant lateral motions (i.e. along latitude circles) on the walls of the bulbs. Apart from the motions of the dusty blobs N4 and S4, no evidence of radial motions (i.e. change of distance from the central star) is found for the inner knots (N1 to N3 and S1 to S3) at the spatial resolution of the ground-based images.
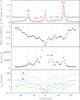 |
Fig. 6 Top: the spatial profile of the [S ii] lines emission in the 2006 WHT spectra. The solid line is the [S ii]6731 line, and the dashed one the 6717 line. Second panel: the F(6717)/F(6731) line ratio. Third panel: the electron density Ne profile. Bottom row: the corresponding recombination timescales for H, N+, and O2+. |
From Fig. 5, it is clear that the [O iii] emission provides clearer insight into these motions. This can be explained by different recombination timescales for different ions, assuming that the gas on the walls of the bulbs is excited by a rotating ionizing beam emitted by the central source. The spatial profile of the [S ii]6717 and [S ii]6731 lines along the slit of the 2006 WHT spectra, the 6717/6731 line flux ratio, and the corresponding electron density Ne profile through the main moving features of M 2–9 are shown in the first three rows of Fig. 6. In the bottom panel, the recombination timescales τrec are plotted for the H, N+, and O2+ ions at the computed Ne and for an electron temperature of the inner lobes of 10 000 K (Trammell et al. 1995). Ne is about 104 cm-3 at the positions of N1/S1, 5 × 103 cm-3 at the base of S2/N2, and of the order of 103 cm-3 along the feathers. At a density of 104 cm-3, τrec for the O2+ ion is only two months. This means that the [O iii] emission switches off as soon as the ionizing beam sweeps past. By comparison, at these densities τrec is nine months for the N+ ion, and seven years for hydrogen. This explains the tails of emission seen eastward of the moving features in the Hα+[N ii] images, and why the tails of S2/N2 (which are half as dense, implying twice τrec) are more pronounced than those of N1/S1. For the feathers, ten times less dense than N1/S1, the recombination time in Hα is so long that their Hα emission should persist for a century or so. Thus, the [O iii] line is the most faithful marker of the present position of the exciting beam.
Taking advantage of the favourable orientation of the rotating features, we quantified the concept presented by 2 of a corkscrew geometry of the pattern. In particular, we focussed our attention on features N1 and S1, and on the base of features N2 and S2, whose position is the most accurately measured. Outside N2 and S2, the pattern becomes more diffuse. We assume axial symmetry for the bulbs and the inclination determined in Sect. 3. The contour of the bulbs is drawn taking advantage of the high resolution HST images. Under these assumptions, any feature can be located unambiguously on the walls of the bulbs, and its latitude and longitude determined. The longitude, which is the crucial descriptive parameter, was determined at each epoch by the Gaussian fitting of the position in the [O iii] image of the base of features N1, N2, S1, and S2. Longitude zero is set at “inferior conjunction” of the features, i.e. at their closest passage to the Earth through the plane that is perpendicular to the plane of the sky and contains the symmetry axis of the bulbs. Uncertainties mainly come from the asymmetry of the features. Images before 1999 were discarded because the determination of longitudes is more uncertain because of projection effects. The variation in longitude with time is shown in Fig. 7. A delay of N2 with respect to N1, as well as S2 with respect to S1, is clearly evident. In other words, excitation of the [O iii] emission at a given longitude of the bulbs occurs later at the higher latitudes of N2 and S2 than at the lower latitudes of N1 and S1. This confirms the results of 2. Averaging the linear fit of the motion of N1 and S1, which are the sharpest and hence provide the most reliable measurements, gives a period for the rotating pattern of 92 ± 4 years. Passage at longitude zero occurred at the beginning of 2004 for N1, and at the end of 2005 for S1. The average delay of N2 and S2 to reach the same longitude as N1 and S1, respectively, is 1.9 years. The apparent tendency to increase in the southern side in the past three years needs to be confirmed by future data.
The older photographic images from 1952, 1971, and 1977 in 1 and 4 can be used to check the rotational period determined above. Given the limited quality of those images, both intrinsic and related to the reproduction on paper in the articles, a useful determination of the longitude can be attempted only for knot N1. Figure 8 shows the estimated position of N1 on the older dates (empty circles with errorbars), compared to the fit of the motion (dotted line) determined using the 1999–2010 measurements (dots) as in Fig. 7. It appears that, even considering the relatively large errors (10 to 15 degrees), the old measurements lie below the fitting line, indicating a steeper slope than presently measured, and therefore suggesting that the rotation of the pattern was faster in the preceding ~50 years than in the period 1999–2010. According to the hypothesis that the rotating pattern is directly linked to the orbital motion in a binary system, as discussed in the next section, these angular speed variations may indicate that the orbit is eccentric. With only three rather uncertain points available before 1996, the orbital parameters cannot be tightly constrained. Even so, a small eccentricity e = 0.10 ± 0.05 (corresponding to an axial ratio of 0.995 for the orbit ellipse) is enough to reproduce the data, as shown by the long-dashed blue line in Fig. 8. The orbital period would then be P = 86 ± 5 years, and the passage at periastron would have occurred between 1968 and 1984.
A remarkable and unexpected pair of new features resembling “fishing hooks” appeared after 2005. They consist of arcs departing from S3 and – more clearly – from N3, extending along the west edge of the bulbs. They are most clearly seen in [O iii] in Fig. 5 (labelled “N hook” and “S hook”), and have become progressively brighter spanning an increasing range of latitudes. On the northern side, the feature has developed a bridge to N2. While the fishing hooks S1 and S2 have progressively brightened, knots N1 and N2 seem to have faded considerably from 2006 on. In addition, a pair of inner knots have appeared in the past three years in the [O iii] images at the edge of the nuclear PSF. These are not apparent in the 2001 HST image of Fig. 4, and are labelled as N0 and S0 in Fig. 5.
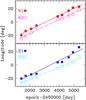 |
Fig. 7 Variation in the longitude of the rotating features of M 2–9 between 1999 and 2010. The error in each longitude determination varies with feature and epoch, but on average is of a few degrees. The linear fits are also shown as solid and dashed lines. |
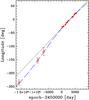 |
Fig. 8 Longitude motion of knot N1, including all our data and those obtained from the analysis of the photographic images of 1952, 1971, and 1977 (empty circles with errorbars). The dot line is the linear fit obtained using the CCD images from 1999 and 2010 as in Fig. 7. The long-dash (blue) line is the fit for an eccentric orbit of period 86 yr, eccentricity 0.1, and passage at periastron in 1977. |
5. Discussion: rotating jet or light beam?
As discussed in 2, the delay between N1 and S1 (and S1 and S2) is a measure of the travel time (thus of the speed) of the ionizing beam, if the beam is ejected meridionally. With the distance and inclination determined in Sect. 3, this would result in a remarkable beam speed between 11 000 and 16 000 km s-1, supporting the conclusion of 2 that the ionizing beam is a collimated spray of high velocity particles emitted by the central source of M 2–9. In other words, a highly supersonic, tenuous, and rotating jet would shock and excite the walls of the inner cavity of M 2–9 (the bulbs) as it hits them. For the alternative hypothesis of a beam of energetic photons, the travelling time from N1 to N2, or S1 to S2, would instead be of only one month, rather than the 1.9 years measured.
In this scenario, the walls of the inner cavity are ionized by the shocks produced by the impact of the jet particles. The possibility that the cavity is excavated (inflated) by the jet itself should also be considered (Soker 2002, 2004). This would explain the formation of the inner lobes and the rotating pattern. If the outer lobes are the result of an excitation gradient and not independent structures (Sect. 4.1, Smith et al. 2005), then no additional mechanisms other than jet shaping would be needed to explain the main morphological structures of M 2–9.
The resulting nebular spectrum would depend on several parameters, among others the jet properties, the physical conditions of gas on the walls of the cavity, and the geometry that determines the angle of incidence of the jet onto the walls. In this respect, N1, S1, N2, and S2 seem to be located at latitudes corresponding to inflexion points in the curvature of the bulbs (see the [N ii] image in Fig. 4). In addition, the “empty” regions in the rotating pattern between the core and N1, between N1 and N2 (and the symmetrical ones in the southern side) correspond to slopes of the walls almost radially directed from the central star. It is possible that the appearance/disappearance of the rotating pattern with latitude (and its ionization structure, with [N ii] closer to the star than [O iii] in S1 and N1) is related to different incidence angles (high/low, respectively) of the jet on the walls of the cavity, i.e. different entrance velocity of the jet into the upstream material.
We can imagine the following process for the formation of knots N3 and S3 and the “fishing hooks”, which seem confined within the bulbs. The prominent [Fe ii] 1.64 μm emission most likely indicates the existence of shocks all around the edge of the bulbs. The dense layer formed in the shocks prevents any ionized gas created by the jet escaping. Therefore, some of the created double-ionized oxygen might flow to higher latitudes along the cavity interior, after receiving a little momentum from the high-speed particle beam. If the density of this gas drops a bit, it recombines relatively slowly and persists for a longer time than the knots N1, N2, S1, and S2. It would therefore drift toward the polar caps of the bulbs becoming visible as N3 and S3, and beyond them on the opposite wall (which presently corresponds to the western side) giving rise to the “fishing hooks”. In other words, the bulb walls would force hot gas to slide along them, and form N3, S3, and the “fishing hooks”. The bridge to N2 could also be hot gas that it is sprayed after the beam shocks N2. The formation of the feathers, which appear to extend outside the bulbs along the inner skin of the extended lobes of M 2–9, is more difficult to imagine: fully 3D radiative-hydrodynamical modelling is needed to explain them and more in general the complexity of the phenomena observed.
In the proposed scenario, it is possible that no significant stellar ionizing radiation is emitted or escapes from the dense cocoon of gas that surrounds the star. Shocks from the jet produce most of the ionization observed, which at the density of the gas results in short-lived [O iii] emission (due to its fast recombination time) and more long-lived Hα emission, persisting enough that hydrogen never becomes entirely neutral before the jet swings around again in its ninety-year rotation. Even if soft stellar UV radiation helps in preventing the singly-ionized gas from fully recombining, cooling, and becoming neutral (Trammell et al. 1995), its role would not be predominant. In a future paper, we will present a detailed spectroscopic analysis of the ionized gas in the rotating pattern, in order to test – among other things – the hypothesis that shock excitation by a jet is primarily responsible for the observed emission in the lobes.
Another basic property of the rotating pattern of M 2–9 is its mirror symmetry with respect to the the equatorial plane of the nebula. A two-sided jet in which each side bends toward the same direction as it travels through a circumstellar medium with a strong density gradient (produced for instance by the massive wind of a red-giant companion) can explain this property (Livio & Soker 2001; Soker & Bisker 2006). This would directly link the observed motions to the orbital period of a symbiotic-like binary central star. If so, the difference in the angular velocity of the pattern over the past ten years and the period covered by the oldest images (1950–1980) may indicate that the orbit has a modest eccentricity.
The alternative scenario is the one proposed by several authors (e.g. Livio & Soker 2001), in which the rotating pattern is photoionized. In this case, a mirror-symmetric rotating jet is also invoked to clear a path for the ionizing radiation from the central star in the dense circumstellar environment along the directions where the [O iii] emission is observed. However, for the time being we favour the idea that the jet particles themselves rather than photons ionize the nebula, because in this way the delay of the propagation of the pattern with latitude is a natural consequence of the limited speed of the jet compared to light. In the case of a light beam, a complex system of “holes” in the circumstellar cocoon (with a geometry that does not change with the rotation of the whole structure) would be needed to photoionize simultaneously the knots observed at different latitudes and longitudes.
If the cause of the phenomenon is a rotating jet, its ≥ 10 000 km s-1 speed would be unusually high for planetary nebulae and pre-planetary nebulae, where the observed highly collimated outflows are one or two orders of magnitude slower. Jets in symbiotic stars have generally larger velocities up to several thousand km s-1 (Sokoloski et al. 2004), but still lower than the figure that we estimate for M 2–9. This makes M 2–9 even more unusual, and the discussion of its nature more complex. The ~ 90-yr period of the rotating pattern, the presence of a jet, the nuclear spectrum, and the recent discovery of circumstellar discs (Lykou et al. 2011), suggest the presence of a symbiotic binary star at its centre: a compact star, perhaps a relatively cool white dwarf, accreting from the wind of a giant and producing the rotating jet. System parameters for our revised distance of 1.3 kpc, such as the bolometric luminosity or the circumbinary disc properties in the models by Lykou et al. (2011), are consistent with this hypothesis.
While IR observations further constrain the possible parameters of the binary system (e.g. the stellar masses, Lykou et al. 2011), the conclusive evidence of binarity, i.e. the detection of a luminous red giant companion, is still missing.
Spectroscopy and photometric monitoring at all wavelengths have failed to detect either the spectral features or variability typical of a cool giant (Santander-García et al. 2009). The characteristics of the accreting component are poorly known too. New efforts to unveil the central stars should be considered as a priority for the future.
Online material
Movie – GIF file
Access Supplementary Material
Movie – MOV file
Access Supplementary MaterialThe comparison between the 1997 and 2001 HST images is also available at http://www.astro.washington.edu/users/balick/M2-9/m29_97_01_movie.gif.
Acknowledgments
We are very grateful to the staff of the Nordic Optical Telescope, and in particular Thomas Augusteijn and Johannes Andersen, for making the long-term image monitoring of M 2–9 possible through the NOT fast-tracking programme and discretionary time. We thank the referee, Dr. Olivier Chesneau, for his valuable suggestions. The work of R.L.M.C. and M.S.G. is supported by the Spanish Ministry of Science and Innovation (MICINN) under the grant AYA2007-66804. Support for program 9050 was provided by NASA through a grant from the Space Telescope Science Institute, which is operated by the Association of Universities for Research in Astronomy, Inc., under NASA contract NAS 5-26555.
References
- Acker, A., Marcout, J., Ochsenbein, F., Stenholm, B., & Tylenda, R. 1992, Strasbourg-ESO catalogue of galactic planetary nebulae, ESO Garching [Google Scholar]
- Aller, D. A., & Swings, J. P. 1972, ApJ, 174, 583 [NASA ADS] [CrossRef] [Google Scholar]
- Balick, B. 1989, AJ, 97, 476 [NASA ADS] [CrossRef] [Google Scholar]
- Balick, B., & Hajian, A. R. 2004, AJ, 127, 2269 [NASA ADS] [CrossRef] [Google Scholar]
- Chesneau, O., Lykou, F., Balick, B., et al. 2007, A&A, 473, L29 [NASA ADS] [CrossRef] [EDP Sciences] [Google Scholar]
- Cohen, M., Parker, Q. A., Green, A. J., et al. 2011, MNRAS, accepted [arXiv:1012.2370] [Google Scholar]
- Doyle, S., Balick, B., Corradi, R. L. M., & Schwarz, H. E. 2000, AJ, 119, 1339 [NASA ADS] [CrossRef] [Google Scholar]
- Goodrich, R. W. 1991, ApJ, 366, 163 [NASA ADS] [CrossRef] [Google Scholar]
- Kohoutek, L., & Surdej, J. 1980, A&A, 85, 161 [NASA ADS] [Google Scholar]
- Lykou, F., Chesneau, O., Zijlstra, A. A., et al. 2011, A&A, 527, A105 [NASA ADS] [CrossRef] [EDP Sciences] [Google Scholar]
- Livio, M., & Soker, N. 2001, ApJ, 552, 685 [NASA ADS] [CrossRef] [Google Scholar]
- Monet, D. G., Levine, S. E., Canzian, B., et al. 2003, AJ, 125, 984 [NASA ADS] [CrossRef] [Google Scholar]
- Santander-García, M., Corradi, R. L. M., & Mampaso, A. 2009, in Asymmetrical Planetary Nebulae IV, ed. R. L. M. Corradi, A. Manchado, & N. Soker, IAC, 555 http://www.iac.es/proyecto/apn4/pages/proceedings.php [Google Scholar]
- Schmeja, S., & Kimeswerner, S. 2001, A&A, 377, L18 [NASA ADS] [CrossRef] [EDP Sciences] [Google Scholar]
- Schwarz, H. E., Aspin, C., Corradi, R. L. M., & Reipurth, B. 1997, A&A, 319, 267 [NASA ADS] [Google Scholar]
- Smith, N., Davidson, K., Gull, T. R., Ishibashi, K., & Hillier, D. J. 2003, ApJ, 586, 432 [NASA ADS] [CrossRef] [Google Scholar]
- Smith, N., Morse, J. A., Collins, N. R., & Gull, T. R. 2004, ApJ, 610, L105 [NASA ADS] [CrossRef] [Google Scholar]
- Smith, N., Balick, B., & Gehrz, R. D. 2005, AJ, 130, 853 [NASA ADS] [CrossRef] [Google Scholar]
- Soker, N. 2002, ApJ, 568, 726 [NASA ADS] [CrossRef] [Google Scholar]
- Soker, N. 2004, A&A, 414, 943 [NASA ADS] [CrossRef] [EDP Sciences] [Google Scholar]
- Soker, N., & Bisker, G. 2006, MNRAS, 369, 1115 [NASA ADS] [CrossRef] [Google Scholar]
- Sokoloski, J. L., Kenyon, S. J., Brocksopp, C., Kaiser, C. R., & Kellogg, E. M. 2004, Rev. Mex. Astron. Astrofis. Ser. Conf., 20, 35 [NASA ADS] [Google Scholar]
- Solf, J. 2000, A&A 354, 674 [Google Scholar]
- Torres-Peimbert, S., Arrieta, A., Georgiev, L., & Bautista, M. 2005, in Planetary Nebulae as Astrophysical Tools, ed. R. Szczerba, & G. Stasinska, Am. Inst. Phys., 148 [Google Scholar]
- Trammell, S. A., Goodrich, R. W., & Dinerstein, H. L. 1995, ApJ, 453, 761 [NASA ADS] [CrossRef] [Google Scholar]
- Zweigle, J., Neri, R., Bachiller, R., Bujarrabal, V., & Grewing, M. 1997, A&A, 324, 624 [NASA ADS] [Google Scholar]
All Tables
All Figures
|
Fig. 1 Composition of Hα+[N ii] images of M 2–9 with the identification of features discussed throughout this paper. Where possible, we have tried to maintain the nomenclature used by previous authors. North is up and east is left. The field of view (f.o.v.) is 40′′ × 140′′. |
| In the text | |
|
Fig. 2 Proper motions of the dusty blobs of M 2–9. Top: the total interblob separation. Bottom: the distance from the central source for each blob separately. Core separation for the north and south blobs is indicated by the filled and empty squares, respectively. Least squares fits are shown by the dashed lines. Positions are computed using the intensity-weighted barycentre. |
| In the text | |
|
Fig. 3 Hα (top) and Hβ (bottom) line profiles for the core of M 2–9 (black solid line), north blob (red dotted line), and south blob (blue dashed lines). Velocities in the abscissae are heliocentric. All profiles have been normalized for easier comparison. Note that local structures in the Hβ profiles of the blobs are not real, but caused by a modest signal-to-noise ratio. |
| In the text | |
|
Fig. 4 Top: HST [O iii] (left) and [N ii] (centre) images obtained on June 2001, in a logarithmic intensity scale. North is up and east to the left. The f.o.v. of each box is 20′′ × 64′′. At right, a cartoon illustrating the main morphological features of the inner nebula discussed in the text. Bottom: 5′′ × 5′′ blowup of the inner regions (corresponding to the inset boxes in the upper panels), from the dithered HST images obtained on September 2001. |
| In the text | |
|
Fig. 5 a) Evolution of the rotating pattern of M 2–9 from 1999 to 2010 in the images from the NOT telescope. [O iii] and Hα+[N ii] images are shown in the upper and lower rows, respectively. All images are displayed in a linear intensity scale. North is up and east to the left. The f.o.v. of each box is |
| In the text | |
|
Fig. 6 Top: the spatial profile of the [S ii] lines emission in the 2006 WHT spectra. The solid line is the [S ii]6731 line, and the dashed one the 6717 line. Second panel: the F(6717)/F(6731) line ratio. Third panel: the electron density Ne profile. Bottom row: the corresponding recombination timescales for H, N+, and O2+. |
| In the text | |
|
Fig. 7 Variation in the longitude of the rotating features of M 2–9 between 1999 and 2010. The error in each longitude determination varies with feature and epoch, but on average is of a few degrees. The linear fits are also shown as solid and dashed lines. |
| In the text | |
|
Fig. 8 Longitude motion of knot N1, including all our data and those obtained from the analysis of the photographic images of 1952, 1971, and 1977 (empty circles with errorbars). The dot line is the linear fit obtained using the CCD images from 1999 and 2010 as in Fig. 7. The long-dash (blue) line is the fit for an eccentric orbit of period 86 yr, eccentricity 0.1, and passage at periastron in 1977. |
| In the text | |
Current usage metrics show cumulative count of Article Views (full-text article views including HTML views, PDF and ePub downloads, according to the available data) and Abstracts Views on Vision4Press platform.
Data correspond to usage on the plateform after 2015. The current usage metrics is available 48-96 hours after online publication and is updated daily on week days.
Initial download of the metrics may take a while.