Fig. 3
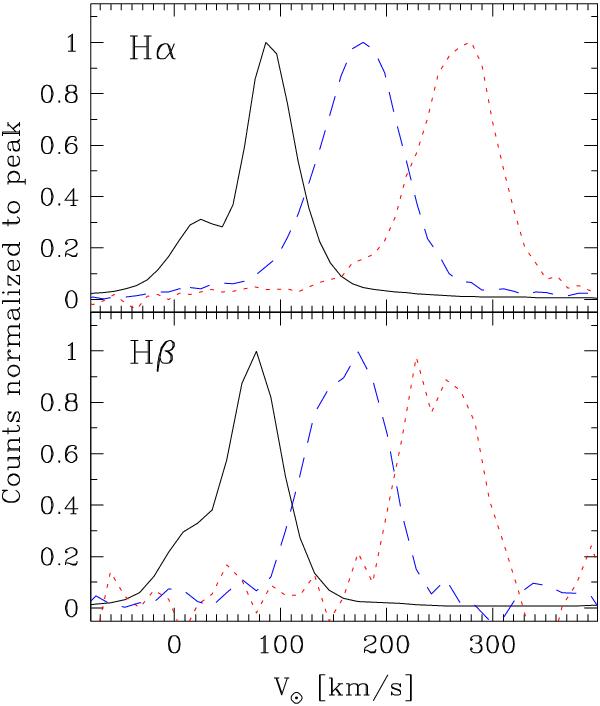
Hα (top) and Hβ (bottom) line profiles for the core of M 2–9 (black solid line), north blob (red dotted line), and south blob (blue dashed lines). Velocities in the abscissae are heliocentric. All profiles have been normalized for easier comparison. Note that local structures in the Hβ profiles of the blobs are not real, but caused by a modest signal-to-noise ratio.
Current usage metrics show cumulative count of Article Views (full-text article views including HTML views, PDF and ePub downloads, according to the available data) and Abstracts Views on Vision4Press platform.
Data correspond to usage on the plateform after 2015. The current usage metrics is available 48-96 hours after online publication and is updated daily on week days.
Initial download of the metrics may take a while.