Fig. 5
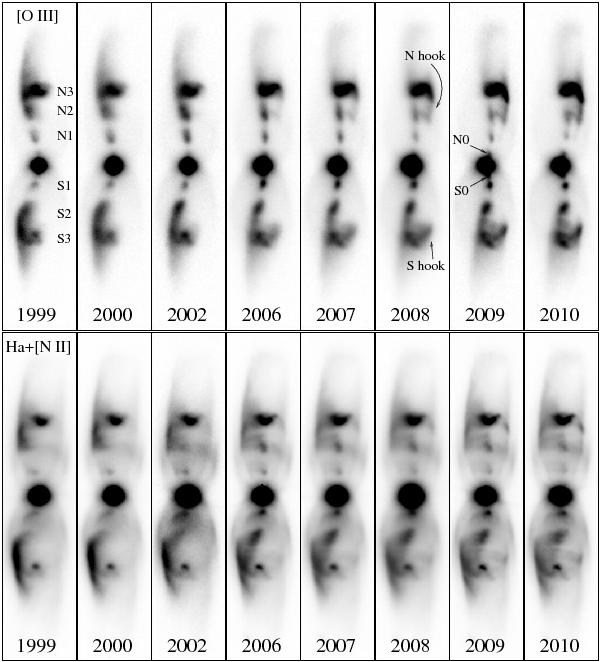
a) Evolution of the rotating pattern of M 2–9 from 1999 to 2010 in the images from the NOT telescope. [O iii] and Hα+[N ii] images are shown in the upper and lower rows, respectively. All images are displayed in a linear intensity scale. North is up and east to the left. The f.o.v. of each box is  . b) Colour animation obtained combining images from 1997 to 2010. Green is the [O iii] emission, red is Hα+[N ii]. This figure is only available in the electronic version of the paper.
Current usage metrics show cumulative count of Article Views (full-text article views including HTML views, PDF and ePub downloads, according to the available data) and Abstracts Views on Vision4Press platform.
Data correspond to usage on the plateform after 2015. The current usage metrics is available 48-96 hours after online publication and is updated daily on week days.
Initial download of the metrics may take a while.