| Issue |
A&A
Volume 529, May 2011
|
|
|---|---|---|
| Article Number | A54 | |
| Number of page(s) | 13 | |
| Section | Galactic structure, stellar clusters and populations | |
| DOI | https://doi.org/10.1051/0004-6361/201016267 | |
| Published online | 31 March 2011 | |
The debris disk host star HD 61005: a member of the Argus association?⋆
1
INAF – Osservatorio Astronomico di Padova, Vicolo dell’Osservatorio 5, 35122 Padova, Italy
e-mail: silvano.desidera@oapd.inaf.it
2
INAF – Osservatorio Astronomico di Napoli, Salita Moiariello 16, 80131 Napoli, Italy
3
INAF – Osservatorio Astrofisico di Catania, via S. Sofia 78, 95123 Catania, Italy
4
Universitá di Catania, Dipartimento di Fisica e Astronomia, via S. Sofia 78, 95123 Catania, Italy
5 College of Charleston, Department of Physics & Astronomy, USA
6
Max Plank Institute for Astronomy, Heidelberg, Germany
Received: 6 December 2010
Accepted: 24 January 2011
Context. HD 61005 is a nearby young solar type star that shows a large infrared excess due to a debris disk. The disk has been recently imaged from ground and space, with indications of several components. Some characteristics of the disk suggest the presence of planetary companions around the star, that remain undetected in deep adaptive optics imaging.
Aims. For a better understanding of the system we aim to refine the determination of the stellar parameters, with emphasis on the stellar age and system orientation.
Methods. We used ASAS and Hipparcos photometry and FEROS spectra to determine the rotation period, radial and rotational velocity, chromospheric emission, effective temperature, and chemical composition.
Results. We find no indication of any misalignment between the star rotation axis and the disk. The standard age calibrations applied to several indicators yield an age close to that of the Pleiades (120 Myr); however the kinematic properties strongly support its membership in the younger (40 Myr) Argus association, which also includes the IC 2391 open cluster. Detailed comparison of the properties of HD 61005 and IC 2391 members shows that the characteristics of HD 61005 are compatible with membership to the Argus association, once its rather slow rotation is taken into account, because lithium and other age indicators are somewhat correlated with stellar rotation at a fixed age. We also identify systematic differences between the field and cluster population of the Argus association, which are probably selection effects, so we suggest that additional members with slower rotation and lower activity level are waiting to be identified.
Key words: stars: individual: HD 61005 / open clusters and associations: individual: Argus association / stars: rotation / stars: abundances / stars: activity / stars: kinematics and dynamics
© ESO, 2011
1. Introduction
HD 61005 is a nearby (≈35 pc) solar type star that hosts a debris disk discovered with Spitzer (Meyer et al. 2006). The infrared excess with respect to the stellar photosphere at 24 μm is the largest that any star shows in the FEPS sample (Meyer et al. 2008). The disk was resolved with HST (Hines et al. 2007; Maness et al. 2009) and VLT (Buenzli et al. 2010) observations; the latter were obtained as part of the NaCo Large Program for Giant Planet Imaging (ESO program 184.C-0567). These studies revealed two components, an external one shaped by the interactions with the interstellar medium and a ring seen nearly edge-on. The ring has a semimajor axis of 61.25 ± 0.85 AU and an eccentricity of 0.045 ± 0.015, and its center is characterized by an offset from the star of 2.75 ± 0.85 AU (Buenzli et al. 2010). Furthermore, Fitzgerald et al. (2010) report preliminary evidence of a second, inner belt from 10 μm observations, whose projection might be misaligned by about 20° with respect to that of the ring. These features might be explained by the presence of planetary companion(s). Indeed similar characteristics in the debris disks of the early type stars β Pic and Fomalhaut were found to be accompanied by giant planets (Kalas et al. 2008; Lagrange et al. 2010, and references therein).
The interpretation of the direct imaging results in terms of planetary mass limits (Buenzli et al. 2010) and of possible future planetary detections heavily relies on the derived stellar age. Hines et al. (2007) estimated the age of HD 61005 to be 90 ± 40 Myr, while Weise et al. (2010) and Roccatagliata et al. (2009) report 30 and 135 Myr, respectively. Considering the special characteristics of this system, the uncertainty in the current age determination, and the availability of new observational data, we performed a new study of the properties of the star, with the goal of improving the stellar age determination. We also intend to derive the orientation of the star rotation axis and compare it with the edge-on orientation of the debris ring (i = 84.3 ± 1°, Buenzli et al. 2010). This is of special relevance considering the high frequency of close-in planets whose normals to the orbital plane are found to be misaligned with respect to the stellar rotation axis (Triaud et al. 2010; Winn et al. 2010). Recently, Lai et al. (2011) have proposed that the interaction between the star and the disk might produce misaligned and even retrograde configurations. Systems with resolved disks and late spectral type that allow determination of the rotation period through photometric monitoring, such as HD 61005, are suitable targets for testing this hypothesis (Watson et al. 2010). An alternative mechanism that produces misaligned systems that might be at work for HD 61005 is to add material from the interstellar medium onto a circumstellar disk, which alters the inclination of the disk (Moeckel & Throop 2010).
Our paper is structured as follows. In Sect. 2 we describe the photometric data and the determination of the rotation period; in Sect. 3 we present the spectroscopic data and the data reduction procedures, and we describe the spectroscopic analysis we performed to derive radial and projected rotation velocity, chromospheric emission, effective temperature, and chemical composition; in Sect. 4, using the results of the previous sections as well as additional literature data, we discuss system properties such as orientation, kinematics, and binarity; in Sect. 5 we derive the stellar age and discuss the membership to the Argus association, and in Sect. 6 we summarize our conclusions.
2. Rotation period
We retrieved photometric time series of HD 61005 from both the ASAS All Sky Automatic Survey archive (Pojmanski 2002) (data collected from November 2000 to November 2009) and the Hipparcos and Tycho epoch photometry archives (data collected from November 1989 to February 1993).
For Hipparcos and Tycho photometry, we selected 240 and 183 measurements, respectively, quoted as quality A or B. After removing very few outliers, we were left with 236 and 180 measurements, respectively. From Hipparcos data we derived a mean magnitude of V = 8.22 and a standard deviation rms = 0.024 mag, whereas the data precision was σ = 0.015 mag. From Tycho data we derived a mean magnitude V = 8.21 and a standard deviation rms = 0.13 mag. However, the data precision was a much poorer σ = 0.11 mag. The Hipparcos and Tycho magnitudes were transformed into the Johnson standard system according to the equations in Perryman et al. (1997).
For ASAS photometry, we retrieved 617 useful measurements (quality A-C). Among five different apertures, we found that a 4-pixel (~30′′ radius) aperture photometry extraction provided the highest photometric accuracy. After removing outliers (by applying a 3σ threshold) we were left with 588 magnitude values useful for subsequent period search. The mean magnitude was V = 8.22 mag with a dispersion of rms = 0.028 mag and an average photometric precision of σ = 0.03 mag. The typical time sampling of ASAS observations was one observation every two to three days.
2.1. Search for rotation period
A visual inspection of the HD 61005 photometric time series clearly shows this star is variable. Based on its late spectral type, we expect this variability to arise from brightness inhomogeneities (starspots) that are carried in and out of view by the star’s rotation, unevenly distributed across the stellar photosphere.
To search for significant periodicities in the HD 61005 ASAS time series coming from stellar rotation, we sectioned the complete series into 14 time intervals never exceeding about two to three months. This approach has the twofold advantage of minimizing possible phase shifts introduced by the growth and decay of active regions, and of allowing us to reveal possible temporal variations in the rotation period that may be related to surface differential rotation.
The Lomb-Scargle periodogram (Scargle 1982) was computed on each segment, as well on the complete time series. In the latter case, provided that the light curve remains quite stable (as proved to be the case of HD 61005), we can detect the rotation period with a much higher precision and confidence level. A more detailed description of the data preparation and period search (determination of false alarm probability and period uncertainty) can be found in Messina et al. (2010a).
2.2. Results
We found that HD 61005 has a rotation period of P = 5.04 ± 0.04 days. The same rotation period is found in the ASAS, Hipparcos, and Tycho photometry. In Table 1 we list the results of our period search. We list the rotation period, its uncertainty, the peak-to-peak light curve amplitude, the photometric precision, the JD time interval in which the period search was performed, the number of measurements, the normalized peak power in the Lomb-Scargle periodogram (at 99% confidence level, as computed from simulation), and the normalized power derived from real data, the brightest magnitude, the source of photometry, and the results derived from the time series without sectioning.
Determination of rotational period on various datasets.
All the rotation period determinations are consistent with each other within the computed errors. The photometric period variations allow derivation of a lower limit to the amplitude of the surface differential rotation (see Messina & Guinan 2003). In the case of HD 61005, these variations are less than 1%, whereas the average period uncertainty is ΔP = 3%. Therefore, based on the available photometry we can exclude the presence of significant ( ≥ 1% at 3σ level) surface differential rotation.
In Fig. 1 we plot the complete ASAS magnitude time series (top panel) together with a selection of time segments. In the left panels, we plot the timeseries magnitudes along with an overplotted sinusoid (solid curve) with a P = 5.04 d rotation period. In the middle panels, we plot the periodograms with indication of the 99% confidence level (horizontal dashed line) and mark the power peak corresponding to the rotation period. Finally, in the right panels we plot the phased light curves using the P = 5.04 d period and the first JD of the time segment as the initial epoch. Here again the solid curve is the fitting sinusoid. In the third panel from top, we notice that there may be time segments where the light curve has a clear rotational modulation, although the power peak does not reach the 99% confidence level.
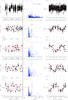 |
Fig. 1 The complete ASAS magnitude time series (top panel), together with a selection of time segments. In the left panels, we plot the time series magnitudes with an overplotted sinusoid (solid curve) of P = 5.04 d rotation period. In the middle panels, we plot the periodograms with indication of the 99% confidence level (horizontal dashed line) and the power peak corresponding to the rotation period. Finally, in the right panels we plot the phased light curves using the P = 5.04 d period and the first JD of the time segment as initial epoch. Here again the solid curve is the fitting sinusoid. |
2.3. Long-term photometric variability
The Lomb-Scargle periodogram analysis performed on the joined ASAS and Hipparcos datasets also reveals a periodic long-term variability with a period of Pcycle = 3.4 ± 0.1 yr and a confidence level larger than 99%. The amplitude appears to change from cycle to cycle, as generally observed in cyclic spotted stars, and reaches a maximum value of about Acycle ≃ 0.08 mag. In Fig. 2 we plot the Hipparcos + ASAS V band magnitude time series with an overplotted fitted sinusoid of P = 3.4 yr cycle. Similar results are obtained when the periodogram analysis is carried out on only the ASAS dataset. The Tycho magnitudes are excluded from this analysis, since their uncertainties are much greater than contemporary Hipparcos magnitudes.
The long-term variation probably represents a starspot cycle consisting of a quasi-periodic change of the star’s spottedness similar to the 11-yr sunspot cycle. It is very interesting to note that rotation period, cycle period, and cycle amplitude of HD 61005 are all very similar to the values observed in the Pleiades-age spotted star DX Leo that has Prot = 5.42 d, Pcycle = 3.1 ± 0.05, and Acycle ≃ 0.12 mag (Messina & Guinan 2002). Both stars are well placed on the active branch observed by Saar & Brandenburg (1999) for the distribution of the activity cycle frequency (normalized to the rotation frequency) versus inverse Rossby number for active stars.
Unfortunately, the B − V color from Tycho, which has quite a large average uncertainty of σB − V = 0.15 mag, is the only one available to investigate the expected color variations of HD 61005 originating from magnetic activity. We averaged the Tycho series of B − V measurements (after removing points with uncertainties above 0.20 mag) using time bins of 200 days in order to explore possible color variations. However, the inferred long-term B − V variations are found to be a factor 2.5 smaller than the average uncertainty. A Pearson linear correlation test shows such long-term B − V variations to be uncorrelated at a significante level α > 50% (cf. Bevington 1969). In the bottom panel of Fig. 2, we plot the V versus B − V measurements from Tycho, along with the binned values. We notice that both individual measurements and average values show the tendency of the star to be bluer when fainter. Owing to the very poor quality of the available photometry, this evidence must be taken with great caution. If the observed trend is real, it may suggest that besides cool starspots, the observed photometric variability of HD 61005 also arises from bright faculae (see, e.g., Messina 2008).
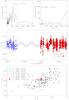 |
Fig. 2 Top panels: the periodogram (left) and the window function (right) obtained from the Lomb-Scargle analysis of the ASAS plus Hipparcos time series. Middle panel: Hipparcos + ASAS V band magnitude timeseries with an overplotted fitted sinusoid of P = 3.4 yr cycle. Bottom panel: V versus B − V measurements from Tycho (individual measurements as well as the binned values). |
2.4. Photometric color
Beside photometric colors in Hipparcos catalogs (B − V = 0.734, V − I = 0.78, from Tycho and Star Mapper respectively), high-quality broad band photometry was performed by Menzies et al. (1990). It does not fully sample stellar variability (mean of 8 measurements); however, the V magnitude (8.225 ± 0.008) agrees very well with the long-term ASAS and Hipparcos magnitudes (see above). Therefore, in the following we adopt the B − V = 0.751 ± 0.003 and V − I = 0.805 ± 0.005 from Menzies et al. (1990). Near-infrared magnitudes are available from 2MASS (J = 6.905 ± 0.026; H = 6.578 ± 0.046 KS = 6.458 ± 0.024). We obtain V − KS = 1.762 ± 0.025.
3. Determination of spectroscopic parameters
We exploited 12 spectra of HD 61005 taken in five nights between December 2003 and March 2006 using FEROS. These data were part of the RV survey for planets around young stars by Setiawan et al. (2008). The FEROS spectra extend between 3600 Å and 9200 Å with a resolving power R = 48 000 (Kaufer et al. 1999). Three spectra were acquired using the object-sky set-up and the remaining using object-calibration mode (see Table 2). The data were reduced using a modified version of the FEROS-DRS pipeline (running under the ESO-MIDAS context FEROS), which yields the wavelength-calibrated, merged, normalized spectrum. The reduction steps were the following: bias subtraction and bad-column masking; definition of the echelle orders on flat-field frames; subtraction of the background diffuse light; order extraction; order by order flat fielding; determination of wavelength-dispersion solution by means of ThAr calibration-lamp exposures; order-by-order normalization, rebinning to a linear wavelength-scale with barycentric correction; and merging of the echelle orders.
3.1. Projected rotational velocity and radial velocity
The radial-velocity (RV) and vsini were determined by cross-correlating the object spectra with a low-vsini template spectrum (i.e. a solar spectrum) obtained with the same instrument and reduced in the same way. The normalized target spectrum was preliminarily rebinned to a logarithmic wavelength scale (Δlnλ ≡ Δv/c = 5 × 10⁻⁶) and split into six wavelength-ranges that are free of emission lines and of telluric absorptions (cf. Esposito et al. 2007). A Gaussian was fitted to the peak of the cross-correlation function (CCF), computed in each of the six distinct spectral ranges. The resulting RV values were averaged with weights (Schisano et al. 2009). The projected rotational velocity vsini was derived from the FWHM of the cross-correlation peak in each of the six ranges above. The relation FWHM-v sin i was obtained by convolving the template spectrum with rotational profiles of vsini from 1 to 100 km s-1. Our measurements are listed in Table 2.
In Table 3 we collect the measurements of vsini available for HD 61005. All the determinations except the one by White et al. (2007), which is based on data with lower spectral resolution, show fairly good agreement. In the following analysis we adopt our own determination (vsini = 8.2 ± 0.5 km s-1).
Measurements of FEROS spectra. OS= Object+Sky OC=Object=Calibration (simultaneous thorium).
Summary of measurements of spectroscopic parameters of HD 61005 available in the literature.
3.2. Teff determination
The determination of the effective temperature was obtained through the method of equivalent widths (EW) ratios of spectral absorption lines, using the calibration for FGK dwarf stars by Sousa et al. (2010). The EWs were measured using the ARES1 automatic code (Sousa et al. 2007). In order to test the performances of ARES on spectra with different rotational broadening, we used a FEROS spectrum of the Sun broadened artificially with rotation profiles of increasing vsini. The resulting values of effective temperature remain consistent (within 50 K) with the accepted value for the Sun up to a rotational velocity of about 18 km s-1 (Fig. 3). For higher rotation velocity, the number of measured line-ratios drops drastically with correspondingly larger errors due to increased line blending. The temperature determinations become unreliable for vsini approaching 30 km s-1.
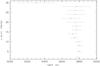 |
Fig. 3 Effective temperature derived with ARES on Sun spectra broadened artificially to various projected rotational velocities. Results are robust for vsini up to 18 km s-1. |
The value of Teff determined by ARES (5550 K) is consistent with those derived from excitation equilibrium as part of the abundance analysis (5500 ± 60 K; Sect. 3.3), from B − V, V − I and V − K colors using the calibration by Casagrande et al. 2010 (5480 K), the relationship between W(Na I D) vs. Teff by Tripicchio et al. (1997) (5550 K), and the previous determination by Hines et al. (2007) (5456 K from SED fitting using Kurucz models).
3.3. Abundance analysis
There was no previous abundance determination based on high resolution spectra. Gray et al. (2006) derived [M/H] = −0.06 from modeling of their low resolution spectrum. The lower value derived by Nordstrom et al. (2004) from Strömgren photometry ([Fe/H] = −0.19) is biased by the effect of stellar activity (see Favata et al. 1997).
We performed elemental abundance analysis for HD 61005, measuring abundances for several iron-peak and α-elements, namely Fe, Ni, Na, Si, Ca, Ti, and the s-process element Ba. The chemical analysis was carried out following the same approach and methodology as in D’Orazi & Randich (2009, hereafter DR09). The Ba content was instead derived as in D’Orazi et al. (2009a), taking isotopic splitting and hyperfine structure into account for both Ba ii features at 5853 Å and 6496 Å (see D’Orazi et al. 2009a, for further details on this issue).
Our procedure can be briefly summarized as follows. We employed the line list provided in DR09, deriving LTE force-fitting abundances with the driver abfind in MOOG (Sneden 1973, 2002 version) and the Kurucz (1993) set of model atmospheres. The EWs were measured with the IRAF task SPLOT, performing a Gaussian fit to line profile. All the features with EW values higher than ~150 mÅ were discarded to avoid spectral lines close to the saturation regime of the curve of growth.
Stellar atmospheric parameters were spectroscopically optimized: effective temperature (Teff) and microturbulence (ξ) values were obtained zeroing the slope of log n(Fe i) with the excitation potential (χ) and with line strengths, respectively. Concerning gravity, we imposed the ionization equilibrium condition, i.e., log n(Fei) − log n(Feii) ≤ 0.05 dex, to derive the log g value.
We obtained Teff = 5500 ± 60 K, ξ = 1.00 ± 0.25 km s-1, and log g = 4.5 ± 0.2 as final adopted parameters. We refer the reader to DR09 for a detailed discussion on error estimates; here we just mention that internal errors, due to EW measurements and atmospheric parameters, are not larger than 0.08 dex. As to systematic (external) errors, our analysis (with the same method, code, line list) of the Hyades star VB 187 indicates that no major uncertainties affect our abundance estimates (see DR09). In Table 4 [Fe/H] and [X/Fe] ratios are reported for HD 61005 along with internal uncertainties due to EW values. The [X/H] ratios were computed by assuming the ones derived by DR09 as solar abundances. As a comparison, average abundances from seven stars in the open cluster IC 2391 are given and the standard deviation from the mean (rms) is provided in correspondence of each [X/Fe] mean ratio.
Metallicity and [X/Fe] ratios for HD 61005, where errors represent uncertainties due to EWs.
3.4. Lithium
The EW of the Li 6708 Å resonance line was determined by Gaussian fitting with the ARES code. (see Table 2). Our result (EW = 171 mÅ) agrees closely with the determinations available in the literature (Table 3).
The Li i feature at 6707.78 Å is an unresolved doublet so we conducted a spectral synthesis analysis to derive a reliable Li abundance. Using the driver synth in MOOG and Kurucz model atmospheres (as previously done for our abundance analysis, see Sect. 3.3), we computed synthetic spectra in a wavelength window of ~15 Å, from 6700 Å to 6715 Å, and employed the line list given in D’Orazi et al. (2009b). As a first step, we optimized the line list by changing the oscillator strengths, i.e. log gf values, when necessary, to obtain the best agreement between our FEROS solar spectrum and the standard iron abundance by Anders & Grevesse (1989). To perform the comparison between the observed spectrum of HD 61005 and the synthetic ones, we convolved the latter with both a Gaussian profile at our resolution of R ~ 48 000 (FWHM = 0.14 Å) and a rotational profile, taking the limb-darkening coefficient into account.
Concerning atmospheric parameters, for consistency we adopted the ones derived from our EW abundance analysis, namely Teff = 5500 K, log g = 4.5, ξ = 1.0 km s-1, and [Fe/H] = 0 dex. As a by-product, the spectral synthesis allowed us to infer the projected rotational velocity and we obtained vsini = 9.0 ± 0.5 km s-1, in perfect agreement with other available estimates (see Table 3).
As shown in Fig. 4, all the observed features are reproduced very well by the synthetic profiles, which simultaneously fit the Fe i lines (6703, 6704, and 6710 Å) and the Li i doublet. The best agreement between observed and synthetic spectra is achieved for a Li abundance of log n(Li) = 2.85 (righthand panel of Fig. 4).
Uncertainties related to the best-fit determination and to the adopted Teff are 0.05 dex and 0.07 dex, respectively (note that Li abundance is only scarcely affected by other stellar parameters, i.e., log g and ξ); to estimate the total error, we quadratically summed both these contributions, given their independence, and we found 0.09 dex. In passing, we also recall that uncertainties due to non LTE (NLTE) and/or three-dimensional model atmospheres can be neglected, since they cancel each other (see Asplund & Lind 2010, for details).
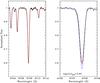 |
Fig. 4 Left panel: spectral synthesis of the region around the Li 6708 Å doublet. Right panel: details of the Li doublet. Overplotted is our best-fit Li abundance (log n(Li) = 2.85; red short-dashed curve) while the dotted and long-dashed curves represent log n(Li) = 2.75 and log n(Li) = 2.95, respectively. |
3.5. Chromospheric emission
Chromospheric emission in CaII H&K lines of HD 61005 was determined by measuring the S index on FEROS spectra as in Desidera et al. (2006). The S index was also measured on 73 FEROS spectra of 41 stars from the lists of Baliunas et al. (1995) and Wright et al. (2004), reduced in the same way as those of HD 61005, to calibrate our instrumental S index onto the standard M. Wilson scale. The dispersion of the residuals of the calibration is 0.026, most likely dominated by the intrinsic variability of chromospheric emission. The variability of the S index measured on 15 spectra of the chromospherically quiet star τ Ceti is 0.0034 (2.0%). Full details of the calibration will be provided in a forthcoming paper. There are other four measurements of H&K emission of HD 61005 in the literature listed in Table 3. The average of our nightly averages and the literature determinations (excluding those by Gray et al. 2006 and White et al. 2007 because of lower accuracy) yields a mean S index of 0.502 (rms 0.017), which corresponds to  . The expected rotational period for a star with such activity level and color using the calibration by Mamajek & Hillenbrand (2008) is 5.01 d, very close to the observed one (5.04 d).
4. System parameters
4.1. Photometric and trigonometric distances
The trigonometric parallax in Van Leuveen (2007) is 28.29 ± 0.85 mas. The position in the color-magnitude diagram agrees with those of the members of other groups in the age range 30–100 Myr, while ages under 20 Myr (see Fig. 5) are excluded. Estimated photometric distances (from B − V, V − I and V − K colors) using the sequences of AB Dor and Tucana associations are 37 and 39 pc, respectively, a not significantly different from the trigonometric one (35.3 ± 1.1 pc, Van Leuveen 2007), which we adopt in the following.
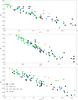 |
Fig. 5 MV vs. B − V, V − I and V − K color magnitude diagrams for HD 61005 (red star), IC 2391 open cluster (black filled circles; data summarized in Messina et al. 2010b), β Pic moving group (orange filled triangles, 10 Myr), Tucana, Carina and Columba associations (green filled squares, 30 Myr) and AB Dor moving group (blue filled, upside-down triangles, 70 Myr). For these associations, only the stars with trigonometric parallaxes among the members selected by Torres et al. (2008) were considered. The position of HD 61005 is compatible with a broad range of ages, older than about 20 Myr. |
4.2. Teff, luminosity, and radius
Using the absolute visual magnitude MV = 5.478 and the bolometric correction − 0.162 from Flower (1996), we derive a luminosity L = 0.583 L⊙. Coupled with the adopted effective temperature of Teff = 5500 K (Sect. 3.2), this gives a stellar radius of R = 0.840 ± 0.038 R⊙ (compatible within errors with the determination by Watson et al. 2010; R = 0.829 ± 0.048 R⊙).
4.3. System inclination
The measured rotational period of 5.04 d coupled with the stellar radius of 0.840 ± 0.038 R⊙ yields a rotational velocity of 8.43 ± 0.38 km s-1. Coupled with our adopted projected rotational velocity of vsini = 8.2 ± 0.5 km s-1, this gives sini = 0.97 ± 0.09 and i = 77° . The ring inclination is 84.3° ± 1 (Buenzli et al. 2010), with a corresponding sini of 0.995.
We conclude that both the star and the disk are viewed close to edge-on and that there are no indications of any misalignment. A similar conclusion was reached by Watson et al. (2010). However, their analysis is based on the expected rotation period from H&K emission and the Noyes et al. (1984) relation rather than the measured value, which was derived for the first time in our study.
4.4. X-ray emission
The star is present neither in the ROSAT all-sky survey (RASS) catalog nor in other X-ray catalogs. We note that there are no sources in the official RASS catalogs within 1.2 deg from HD 61005. This is unexpected considering the young age inferred from other indicators and the distance from the Sun. However, in the paper by Wichmann et al. (2003), an X-ray luminosity log LX = 29.2 for the star is quoted, which was based on a preliminary RASS catalog, which is older than the official one. The source is not in the official catalog most likely because it may have been discarded as spurious in the final RASS data screening (Wichmann 2010, priv. commun.). Therefore, the original RASS data have been kindly revisited by Jürgen Schmitt. The source is clearly recognizable by eye. The EXSAS2 source detection algorithm gives a broad-band count rate of 0.176 ± 0.034 cts/s (32.21 ± 6.27 counts in 272.4 s exposure time, and vignetting correction factor of 1.493) and a hardness ratio practically equal to zero. Adopting the calibration by Hunsch et al. (1999) and the trigonometric distance, an X-ray luminosity log LX = 29.3 ± 0.2 is derived.
4.5. Radial velocity, binarity, and planetary companions
There are no indications of any RV variations with amplitudes larger than 1 km s-1 from the various literature data or from our own RV measurements based on FEROS data. We therefore exclude the star being is a spectroscopic binary. The RV curve by Setiawan et al. (2008) shows a significant scatter with peak-to-peak amplitude of about 150 m/s and a correlation with line profile. Therefore, the RV variability appears dominated by the line profile alterations caused by stellar activity, and the limits on close-in planets are rather coarse, excluding only massive planets in close orbits. The deep imaging also rules out either stellar, brown dwarf, or even massive planetary companions at a projected separation larger than a few tens of AU (Buenzli et al. 2010). The similarity between short-term Hipparcos and historical proper motions also point to a single star. Overall, there are no indications of any massive companions at either short or wide separations. The eccentricity of the ring suggests a giant planet within a few tens of AU (Buenzli et al. 2010).
4.6. Kinematic parameters
The space velocities of HD 61005 are U = −22.2 ± 0.6 km s-1, V = −14.3 ± 0.3 km s-1, and W = −4.1 ± 0.2 km s-1. These are very similar to those of the Argus association (−22.0 ± 0.3 −14.4 ± 1.3 −5.0 ± 1.3) as given in Torres et al. (2008). The space position is X = −13.9 ± 0.4 pc, Y = −32.3 ± 1.0 pc, and Z = −3.3 ± 0.1 pc, which places the star at the outskirts of the known members of the Argus association (Fig. 6).
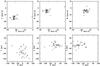 |
Fig. 6 Upper panels: U, V, and W space velocities for HD 61005 (red asterisk) and Argus members from the list of Torres et al. 2008. Square symbols refer to objects with trigonometric parallaxes. Lower panels: space positions X, Y, Z. Symbols as in the upper panels. |
The existence of the Argus association was first proposed by Torres et al. (2003) from SACY data, thanks to its peculiar U velocity. The young open cluster IC 2391 was shown to share the motion and the age of the proposed association. The occurrence of groups of young field stars associated with IC 2391 had been formerly proposed by Eggen (1991) and Makarov & Urban (2000); however, only a minor fraction of their proposed members is part of the Argus association according to Torres et al. (2008).
Torres et al. (2008) give an updated list of members of this association separated as field stars and IC 2391 members (29 and 35 stars, respectively, see also the review by Pettersson 2008). The estimated age of the association is 40 Myr, in the middle of the proposed ages for IC 2391 (30 ± 5 Myr Stauffer et al. 1997 using isochrone fitting, 50 ± 5 Myr Barrado y Navascues et al. 2004 using the Li depletion boundary, 30–50 Myr Platais et al. 2007).
The mean distance of the members in Torres et al. (2008) is 106 pc, much farther than the 35 pc of HD 61005, but a few individual members have comparable distance. The trigonometric distance to IC 2391 is 144.9 ± 2.5 pc (Van Leeuwen 2009), and it is expected that several field members at distances comparable to or larger than IC 2391 wait to be identified (assuming a roughly spherical spatial distribution).
HD 61005 is not included in the member list by Torres et al. (2008). This can be easily understood, because the SACY sample (Torres et al. 2006) is based on a cross-identification of the ROSAT All Sky Bright Source Catalog (Voges et al. 1999), of which HD 61005 is not included (see Sect. 4.4).
The young age clearly resulting from all the indicators described above and the very similar space velocity call for a detailed evaluation of the possible membership of HD 61005 to the Argus association. This is the goal of the next section.
5. The age of HD 61005 and the membership to Argus association
In the previous section we measured or collected from the literature the determination of several parameters that are known to depend on stellar age. We discuss here whether they are compatible with the Argus membership suggested by kinematic properties or if they instead indicate a different age. Application of existing age calibrations is summarized in Table 5. The calibration of lithium EW into age was built using literature measurements of nearby young associations and Pleiades and Hyades open clusters and will be presented elsewhere.
Summary of age determination for HD 61005.
The ages in Table 5 are in general older than the accepted age of the Argus association3. At first sight, this argues against membership. However it is known that most (possibly all) of the HD 61005 age indicators have some correlation with stellar rotation, and show a wide dispersion in coeval (especially young) stellar groups and clusters. A one-to-one correspondence between color and rotation period is definitively reached by an age of about 500–600 Myr (see, e.g., Collier Cameron et al. 2009). The dispersion in rotation rate for coeval systems might be linked to the disk lifetime (disk-locking scenario). The active debris disk of HD 61005 might be a relic of a long-lived primordial disk. This might have prevented the system reaching fast rotation rates, increasing at the same time the lithium depletion (Bouvier 2008). A more detailed discussion is therefore needed to see if there are any known Argus members that are slow rotators and present similar discrepancies in the age indicators to HD 61005. Furthermore, we also consider here additional membership criteria such as chemical composition.
5.1. Rotation period
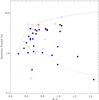 |
Fig. 7 Upper panel: distribution of rotation periods of Argus association (blue squares) and IC 2391 (black circles) members versus B − V color. Confirmed and likely periods are plotted with filled symbols, uncertain periods with open symbols. Data are taken from Messina et al. (2010b). HD 61005 is represented by the (red) star symbol. The dashed and dotted lines represent the upper bounds of the period distribution of Pleiades members (from Barnes 2003). |
The rotation period of HD 61005 was determined in Sect. 2, while those of Argus and IC 2391 members are taken from Messina et al. (2010b). They classified the detection of rotation period as either confirmed, likely, or uncertain depending on the number of significant detections of the periodicity among the segments by which the photometric time series were divided. We use this classification in the following discussion. The four stars (CD-582194 and CD-621197 in Argus, PMM351 and PMM 2182 in IC 2391) for which the rotation period is inconsistent with the spectroscopic vsini are not used in the analysis.
The rotation period of HD 61005 compared to that of members of Argus (field) and IC 2391 is shown in Fig. 7. The distribution of rotation periods of IC 2391 stars appears different from that of Argus field stars, with more slow rotators in the cluster. This might be from the different selection criteria of the IC 2391 cluster and the Argus association field members. Argus field members are identified in the sample of the SACY survey (Torres et al. 2006) and, by definition, have X-ray counterparts in the ROSAT Bright Source Catalog (Voges et al. 1999). Conversely, the members of IC 2391 are selected from a variety of sources, including deep X-ray imaging of the central regions of the cluster (Patten & Simon 1996; Simon & Patten 1998; Marino et al. 2005) or a combination of spectroscopic, astrometric and photometric criteria, without X-ray preselection (Platais et al. 2007). Indeed, several members identified by Platais et al. (2007) only have X-ray counterparts in the ROSAT Faint Source Catalog (Voges et al. 2000), and a few targets have no X-ray counterparts at all (see Appendix A). Since fast rotators have brighter coronal luminosities and the mean distance of Argus association members is 106 pc, we expect that the census of association members is biased toward the most active and fast-rotating stars. We therefore consider the IC 2391 cluster members as a better comparison sample than Argus field members to evaluate the possible link of HD 61005 with this association.
The position of HD 61005 in the color-period plot of Fig. 7 is on the margin of the IC 2391 period distribution, close to a few members (PMM665, PMM1373, PMM4362, and PMM6974) whose rotation period still need confirmation. HD 61005 appears to be along the so-called “interface sequence” that represents the upper bound of the period distribution. Here this sequence is represented by the gyro-isochrone from Barnes (2003) and computed for the Pleiades age of 120 Myr.
We further note that the photometric amplitude is within the distribution of Argus and IC 2391 members with similar rotational period (see right panel of Fig. 6 in Messina et al. 2010b).
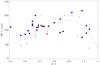 |
Fig. 8 Comparison of Li EW of HD 61005 (red filled star) with that of Argus association field stars (blue squares) and IC 2391 open cluster stars (black circles) Filled symbols refer to stars with confirmed or likely rotational period in Messina et al. (2010b), and open symbols to stars with uncertain or undetermined rotational period in Messina et al. (2010b). The dashed curve is the cubic fit to the locus of IC 2391 members in the range B − V = 0.50−1.10 |
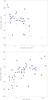 |
Fig. 9 Upper panel: residuals of Li 6708 EW with respect to mean locus vs. B − V defined by IC 2391 members plotted versus rotational period (dashed line in Fig 8). Filled and open (black) circles: IC 2391 stars with confirmed+likely and uncertain rotation periods, respectively; filled and open (blue) squares: Argus field stars, with confirmed+likely and uncertain rotation periods, respectively; (red) star: HD 61005. The continuous line represents the fit of IC 2391 members with confirmed rotational periods, and the dotted line represents the fit including the unconfirmed periods. Lower panel: residuals of Li 6708 EW with respect to mean locus vs. B − V defined by IC 2391 members plotted versus projected rotational velocity. Filled circles: IC 2391. Filled squares: Argus field. (Red) star: HD 61005. |
5.2. Lithium
The comparison of Li EW of HD 61005 with that of Argus association members (Torres et al. 2006) shows that HD 61005 has an EW about 50 mÅ lower than that of members of similar color (Fig. 8). When one instead considers members of the open cluster IC 2391 (from Platais et al. 2007; Randich et al. 2001; Stauffer et al. 1997), HD 61005 falls on the edges of the distribution. The Li EW also fits within the distribution of the Pleiades observations (age about 120 Myr). Application of an age-EW Li-color relation based on data of nearby young associations and Pleiades and Hyades open clusters yields 113 Myr.
It appears that, in spite of the association between IC 2391 and the Argus field stars, IC 2391 members have on average a slightly smaller lithium content. At first sight this can be considered a signature of a small age difference between cluster and field members. However, considering the possible dependence of lithium abundance on rotational period or rotational velocity found by Soderblom et al. (1993) for the Pleiades and by Da Silva et al. (2009) for members of young associations, this may just be a result of the selection effects described above.
To take isuch a dependence on rotation into account, we derived the mean locus of IC 2391 members on the Li EW vs. B − V diagram and the residuals from it. When plotting such residuals versus rotational period, a correlation is found with significant results at about 2 σ (Fig. 9). HD 61005 fits such relation(s) fairly well, i.e. it has the expected lithium content for IC 2391 stars with its rotational period. A similar trend is also seen considering the projected rotational velocity.
5.3. Chromospheric and coronal activity
There are no members of Argus association with measured H&K emission, so no comparison is possible for this indicator. X-ray data of IC 2391 are taken from several sources and summarized in Appendix A. X-ray data of Argus field members are all taken from the ROSAT Bright Source Catalog. Figure 10 shows the distribution of log LX/Lbol for members of Argus association, IC 2391 open cluster, and HD 61005. It results that HD 61005 has a lower X-ray luminosity than most of the Argus and IC 2391 members, where a few slow rotators have similar coronal luminosities. A few other members have no X-ray detections in ROSAT All Sky Survey. A systematic difference between field stars and IC 2391 members is also seen in X-ray emission, most likely due to the selection effects previously discussed.
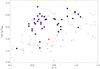 |
Fig. 10 Distribution of log LX/Lbol of IC 2391 (filled circles), Argus association (blue filled squares), and Pleiades members (open squares and open triangles for detections and upper limits respectively; data taken from Stauffer et al. 1994) versus B − V colour. HD 61005 is plotted as a (red) star. A few IC 2391 members are not detected in X-ray. |
5.4. Chemical composition
Abundance ratios of iron-peak and α-elements for HD 61005 are very similar to those derived for IC 2391 members by DR09, reflecting in both cases a solar chemical composition. The mean difference in [X/Fe] ratios of our star with IC 2391 is only ~ 0.02 dex, when considering all the elements listed in Table 4. Our analysis was performed in the same way as that presented in DR09 and D’Orazi et al. (2009a) for IC 2391 members, so that systematic errors in the abundance scale are not of concern for such comparison. In Fig. 11, we show [X/Fe] ratios as a function of [Fe/H] for HD 61005 along with the average values and their corresponding standard deviation as obtained from IC 2391 stars. Similarly, Argus association field stars have a nearly solar iron content (Viana Almeida et al. 2009). This provides further support for the link between HD 61005 and the Argus association. However, concerning Fe, Na, Si, Ca, Ti, and Ni, IC 2391 does not have a peculiar abundance pattern with respect to nearby young stars: all the young clusters/associations surveyed so far from a chemical point of view show a composition that is very close-to solar (Santos et al. 2008; D’Orazi et al. 2009b; Biazzo et al. 2011). This means that the chemistry cannot conclusively state the physical association of HD 61005 to Argus.
On the other hand, a very interesting datum is given by the Ba content: HD 61005 shares with IC 2391 dwarfs the unusual, extremely high [Ba/Fe] ratio, which is about a factor of five above the solar value ( [Ba/Fe] ≈ 0.7 dex). As discussed in D’Orazi et al. (2009a), this anomalous Ba abundance is likely due to NLTE effects (probably arising from over-ionization phenomena caused by the high level of chromopsheric activity that is typical of young solar type stars, see e.g. Schuler et al. 2010) rather than to a real higher content of neutron-capture elements in young, nearby stars. However, our result points out that the [Ba/Fe] trend in HD 61005 is very different from the one derived for old, solar-type stars, providing an independent, complementary observational hint of the young nature of this object (see D’Orazi et al. 2009a, for a detailed discussion on the relationship between Ba and cluster age).
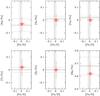 |
Fig. 11 Abundances of individual elements of HD 61005 compared to those of IC 2391 (from D’Orazi & Randich 2009; and D’Orazi et al. 2009a). |
5.5. IR excess
As mentioned in Sect. 1, HD 61005 has a very large IR excess. We briefly discuss this in the context of our revised age of the system, because the occurrence of an IR excess and its amount with respect to the photosphere are both observed to decline with age. IC 2391 was observed at 24 μm with Spitzer by Siegler et al. (2007), resulting in a frequency of FGK stars with IR excess of  %, which fits the trend toward decreasing IR excess as a function of age, as observed for other clusters. No observations of IR excess have been published for the field members of the Argus association. HD 61005 has a 24 μm excess (fexcess/fphot = 1.096 ± 0.049; Meyer et al. 2008) that is more than for any star in IC 2391 included in the Siegler et al. (2007) sample, with the F3 star HD74374 = PMM1174 just below this value (fexcess/fphot = 0.98).
No clear trend toward IR excess with stellar rotation results from IC 2391 data: IR excess is found on slow rotators like PMM 44134 and PMM 4467, but also on the very fast rotator PMM 1820. Observations of the whole cluster, as well as the field members of the association, might provide higher quality statistics for this kind of analysis. A similar analysis for the Pleiades open cluster is also inconclusive: Greaves et al. (2009) note that the four solar type stars with 24 μm excess are slow rotators but selection effects might be at work because half of fast rotators have no excess measurement, because they are projected in a region of heavy cirrus (Gorlova et al. 2006).
6. Conclusion
We have examined several properties of HD 61005 with the goals of a better characterization of the system and a robust determination of its age. We determined rotation period, radial and projected rotational velocity, chromospheric emission, effective temperature, and chemical composition (see Table 6 for a summary of target properties). From projected rotational velocity and rotation period we inferred that the star is seen close to edge-on. In that case, there is no indication of any significant misalignment with the debris disk.
Summary of parameters of HD 61005.
We found that when applying the standard age calibrations to the values of several age indicators (lithium, chromospheric and coronal emissions, rotation period) HD 61005 results of age comparable to that of the Pleiades (120 Myr). However, the kinematic parameters strongly indicate membership in the Argus association, which is significantly younger (40 Myr; Torres et al. 2008). We then compared the properties of HD 61005 to those of Argus association members, including the open cluster IC 2391. We found that HD 61005 parameters are on the edges but not outside the distribution of IC 2391 members. The lithium content and coronal emission are similar to those of members of IC 2391 of comparable rotational period. HD 61005 also has a similar chemical composition to IC 2391.
HD 61005, therefore, can have the same age as the slowly rotating, less active, and (relatively) Li-poor stars in IC 2391. The kinematic parameters strongly indicate that this is indeed the case. We therefore conclude that the association with Argus is very likely and the age of HD 61005 is about 40 Myr.
The younger age for HD 61005 than currently assumed (90 Myr, Hines et al. 2007) has a significant impact on the detection limits of planetary companions in direct imaging programs. Buenzli et al. (2010) derive limits of about 3 and 5 MJ at 50 and 15 AU, respectively, assuming a 90 Myr age. These limits become significantly smaller when taking the revised age into account. Therefore, only less massive planets may perturb the disk and be a likely cause for the peculiar features described in Sect. 1. Dedicated modeling of the possible masses and locations of planets that might explain the disk features are needed.
A younger age also helps in explaining the unusually large IR excess observed for HD 61005, since debris disk frequency and luminosity are known to decline with age (Evans 2009; Wyatt 2008). However, even at an age of 40 Myr, the 24 μm excess of HD 61005 still turns out to be larger than that of any IC 2391 member for which suitable data are available. The solar abundance of HD 61005 is consistent with the lack of significant metallicity differences between stars with debris disks and general field stars, at odds with what has been found for the parent stars of giant planets (Greaves et al. 2006).
Finally, from our comparison of HD 61005 with the Argus association, differences can be noted between field and cluster members in Li EW, X-ray luminosity, and possibly in rotational period distributions. Argus field stars are on average more active, rotate faster, and have more lithium than their IC 2391 cluster counterparts.
A small age difference (5–10 Myr), with field stars being slightly younger than cluster members, might explain the lithium difference. A vigorous star formation event followed by supernova explosion(s) might have triggered star formation in nearby regions, with some delay after the cluster was formed. This kind of scenario is envisaged for the Sco-Cen complex as a sequence of star formation events, involving Lower Centaurus Crux, Upper Centaurus Lupus, Upper Scorpius, TW Hyd association, ϵ and η Cha (Ortega et al. 2009).
However, our favorite explanation for these differences is a selection effect of Argus field stars all being selected from the SACY sample (Torres et al. 2006), which only includes stars with X-ray counterparts in the ROSAT Bright Star Catalog (Voges et al. 1999), while IC 2391 members are selected using a variety of membership indicators. Our adopted target list of IC 2391 members from Torres et al. (2008) includes additional selection criteria aimed at better defining the kinematical properties of the association (excluding known or suspected spectroscopic binaries unless an orbital solution is available).
Our results suggest that, at least for the associations beyond 100 pc in the Torres et al. (2008) list, a selection criterion based on inclusion in the ROSAT Bright Star Catalog might have caused a bias towards the most active and fast rotating stars. Therefore, we suggest that other less active, slowly rotating members probably still wait to be identified.
If the different disk lifetime is one of the causes of the dispersion of stellar rotation rates in coeval groups of young stars and if planet formation occurs more easily in long-lived disks, the selection bias that we identified might have a significant impact for disk and planet searches. The correlation of lithium and other age indicators with stellar rotation might also cause the age determination for isolated field stars to be biased if such a dependency is not taken into account.
EXSAS stands for Extended Scientific Analysis System to evaluate RASS data; see Zimmermann et al. (1994) for details.
Weise et al. (2010) estimated an age of 30 Myr for HD 61005 from Li EW. This is partially due to the younger ages assumed for the clusters adopted as calibrators.
PMM 4413 is similar to HD 61005 in several aspects: it has a slightly earlier spectral type, slow rotation (Prot = 5.05 d), faint Xray emission (log LX/Lbol = −4.47), Li EW below the mean locus of the cluster and presence of 24 μm excess. However, it is a double-lined spectroscopic binary with orbital period 90 days (Platais et al. 2007).
Acknowledgments
We thank the NaCo Large Program Collaboration for Giant Planet Imaging (ESO program 184.C-0567) for calling our attention to HD 61005. We thank R. Wichmann and J. H. M. M. Schmitt for useful information on the X-ray properties of the star, for checking the original RASS image, and for providing an updated value of the X-ray count rate. This research has made use of the SIMBAD database, operated at CDS, Strasbourg, France J.C.C. was supported in part by NSF AST 1009203.
References
- Anders, R., & Grevesse, N. 1989, Geochim. Cosmochim. Acta, 53, 197 [Google Scholar]
- Asplund, M., & Lind, K. 2010, The light elements in the Universe, ed. C. Charbonnel, M. Tosi, F. Primas, & C. Chiappini, IAU Proc., 268, 191 [Google Scholar]
- Baliunas, S. L., Donahue, R. A., Soon, W. H., et al. 1995, ApJ, 438, 269 [NASA ADS] [CrossRef] [Google Scholar]
- Barnes, S. A. 2003, ApJ, 586, 464 [NASA ADS] [CrossRef] [Google Scholar]
- Barnes, S. A. 2007, ApJ, 669, 1167 [NASA ADS] [CrossRef] [Google Scholar]
- Barrado y Navascues, D., Stauffer, J. R., & Jayawardhana, R. 2004, ApJ, 614, 386 [NASA ADS] [CrossRef] [Google Scholar]
- Bevington, P. R. 1969, in Data Reduction and Error Analysis for the Physical Sciences (New York: McGraw-Hill Book Company) [Google Scholar]
- Biazzo, K., Randich, S., & Palla, F. 2011, A&A, 525, A35 [NASA ADS] [CrossRef] [EDP Sciences] [Google Scholar]
- Bouvier, J. 2008, A&A, 489, L53 [NASA ADS] [CrossRef] [EDP Sciences] [Google Scholar]
- Buenzli, E., Thalmann, C., Vigan, A., et al. 2010, A&A, 524, L1 [NASA ADS] [CrossRef] [EDP Sciences] [Google Scholar]
- Casagrande, L., Ramírez, I., Meléndez, J., Bessell, M., & Asplund, M. 2010, A&A, 512, A54 [NASA ADS] [CrossRef] [EDP Sciences] [Google Scholar]
- Collier Cameron, A., Davidson, V. A., Hebb, L., et al. 2009, MNRAS, 400, 451 [NASA ADS] [CrossRef] [Google Scholar]
- Da Silva, L., Torres, C. A. O., & de La Reza, R. 2009, A&A, 508, 833 [NASA ADS] [CrossRef] [EDP Sciences] [Google Scholar]
- Desidera S.,Gratton, R. G., Lucatello, S., Claudi, R. U., & Dall, T. H. 2006, A&A, 454, 553 [NASA ADS] [CrossRef] [EDP Sciences] [Google Scholar]
- Donahue, R. A. 1993, PhD Thesis New Mexico State Univ., University Park [Google Scholar]
- D’Orazi, V., & Randich, S. 2009, A&A, 501, 553 [NASA ADS] [CrossRef] [EDP Sciences] [Google Scholar]
- D’Orazi, V., Magrini, L., Randich, S., et al. 2009a, ApJ, 693, L31 [NASA ADS] [CrossRef] [Google Scholar]
- D’Orazi, V., Randich, S., Flaccomio, E., et al. 2009b, A&A, 501, 973 [NASA ADS] [CrossRef] [EDP Sciences] [Google Scholar]
- Eggen, O. J. 1991, AJ, 102, 2028 [NASA ADS] [CrossRef] [Google Scholar]
- Esposito, M., Covino, E., Alcalá, J. M., Guenther, E. W., & Schisano, E. 2007, MNRAS, 376, 1805 [NASA ADS] [CrossRef] [Google Scholar]
- Evans, N. J., Dunham, M. M., Jorgensen, J. K., et al. 2009, ApJS, 181, 321 [NASA ADS] [CrossRef] [Google Scholar]
- Favata, F., Micela, G., Sciortino, S., & Morale, F. 1997, A&A, 324, 998 [NASA ADS] [Google Scholar]
- Fitzgerald, M. P., Kalas, P., Graham, J. R., & Maness, H. M. 2010, In the Spirit of Lyot 2010 [Google Scholar]
- Flower, P. J. 1996, ApJ, 469, 355 [NASA ADS] [CrossRef] [Google Scholar]
- Gorlova, N., Rieke, G. H., Muzerolle, J., et al. 2006, ApJ, 649, 1028 [NASA ADS] [CrossRef] [Google Scholar]
- Gray, R. O., Corbally, C. J., Garrison, R. F., et al. 2006, AJ, 132, 161 [NASA ADS] [CrossRef] [Google Scholar]
- Greaves, J. S., Fischer, D. A., & Wyatt, M. C. 2006, MNRAS, 366, 283 [NASA ADS] [CrossRef] [Google Scholar]
- Greaves, J. S., Stauffer, J. R., Collier Cameron, A., Meyer, M. R., & Sheehan, C. K. W. 2009, MNRAS, 394, L36 [NASA ADS] [Google Scholar]
- Henry, T. J., Soderblom, D. R., Donhaue, R. A., & Baliunas, S. L., 1996, AJ, 111, 439 [NASA ADS] [CrossRef] [Google Scholar]
- Hines, D. C., Schneider, G., Hollenbach, D., et al. 2007, ApJ, 671, L165 [NASA ADS] [CrossRef] [Google Scholar]
- Hünsch, M., Schmitt, J. H. M. M., Sterzik, M. F., & Voges, W. 1999, A&AS, 135, 319 [NASA ADS] [CrossRef] [EDP Sciences] [Google Scholar]
- Kalas, P., Graham, J. R., Chiang, E., et al. 2008, Science, 322, 1345 [NASA ADS] [CrossRef] [PubMed] [Google Scholar]
- Kurucz, R. L. 1993, CD-ROM Nr. 9 [Google Scholar]
- Kaufer, A., Stahl, O., Tubbesing, S., et al. 1999, ESO Messenger, 95, 8 [NASA ADS] [Google Scholar]
- Lagrange, A.-M., Bonnefoy, M., Chauvin, G., et al. 2010, Science 329, 57 [NASA ADS] [CrossRef] [PubMed] [Google Scholar]
- Lai, D., Foucart, F., & Lin, D. N. C. 2011, MNRAS, accepted [arXiv:1008.3148] [Google Scholar]
- Makarov, V. V., & Urban, S. 2000, MNRAS, 317, 289 [NASA ADS] [CrossRef] [Google Scholar]
- Mamajek, E. E., & Hillenbrand, L. A. 2008, ApJ, 687, 1264 [NASA ADS] [CrossRef] [Google Scholar]
- Maness, H. L., Kalas, P., Peek, K. M. G., et al. 2009, ApJ, 707, 1098 [NASA ADS] [CrossRef] [Google Scholar]
- Marino, A., Micela, G., Peres, G., Pillitteri, I., & Sciortino, S. 2005 A&A, 430, 287 [NASA ADS] [CrossRef] [EDP Sciences] [Google Scholar]
- Menzies, J. W., Marang, F., & Westerhuys, J. E. 1990, S. Afr. Astron. Obs., Circ., No. 14, 33 [Google Scholar]
- Messina, S. 2008, A&A, 480, 495 [NASA ADS] [CrossRef] [EDP Sciences] [Google Scholar]
- Messina, S., & Guinan, E. F. 2002, A&A, 393, 225 [Google Scholar]
- Messina, S., & Guinan, E. F. 2003, A&A, 409, 1017 [NASA ADS] [CrossRef] [EDP Sciences] [Google Scholar]
- Messina, S., Desidera, S., Turatto, M., Lanzafame, A. C., & Guinan, E. F. 2010a, A&A, 520, A15 [NASA ADS] [CrossRef] [EDP Sciences] [Google Scholar]
- Messina, S., Desidera, S., Lanzafame, A. C., Turatto, M., & Guinan, E. F. 2010b, A&A, submitted [Google Scholar]
- Meyer, M. R., Hillenbrand, L. A., Backman, D., et al. 2006, PASP, 118, 1690 [NASA ADS] [CrossRef] [Google Scholar]
- Meyer, M. R., Carpenter, J. M., Mamajek, E. F., et al. 2008, ApJ, 673, L181 [NASA ADS] [CrossRef] [Google Scholar]
- Moeckel N., & Throop H. B. 2009, ApJ, 707, 268 [NASA ADS] [CrossRef] [Google Scholar]
- Noyes, R. W., Hartmann, L. W., Baliunas, S. L., Duncan, D. K., & Vaughan, A. H. 1984, ApJ, 279, 763 [NASA ADS] [CrossRef] [Google Scholar]
- Nordstrom, B., Mayor, M., Andersen, J., et al. 2004, A&A, 418, 989 [NASA ADS] [CrossRef] [EDP Sciences] [Google Scholar]
- Ortega, V. G., Jilinski, E., de la Reza, R., & Bazzanella, B. 2009, AJ, 137, 3922 [NASA ADS] [CrossRef] [Google Scholar]
- Patten, B. M., & Simon T. 1996, ApJS, 106, 489 [NASA ADS] [CrossRef] [Google Scholar]
- Perryman, M. A. C., The Hipparcos Science Team, 1997, ESA SP-1200, 1–12, ESA Publ. Divisiona, c/o ESTEC, Noordwijk, The Netherlands [Google Scholar]
- Petterson, B. 2008, Handbook of Star Forming Regions, Volume II: The Southern Sky ASP Monograph Publications, ed. Bo. Reipurth, 5, 43 [Google Scholar]
- Platais, I., Melo, C., Mermilliod, J. C., et al. 2007, A&A, 461, 509 [NASA ADS] [CrossRef] [EDP Sciences] [Google Scholar]
- Pojmanski, G. 2002, Acta Astron., 52, 397 [NASA ADS] [Google Scholar]
- Randich, S., Pallavicini, R., Meola, G., Stauffer, J. R., & Balachandran, S. C. 2001, A&A, 372, 862 [NASA ADS] [CrossRef] [EDP Sciences] [Google Scholar]
- Roccatagliata, V., Henning, Th., Wolf, S., et al. 2009, A&A, 497, 409 [NASA ADS] [CrossRef] [EDP Sciences] [Google Scholar]
- Saar, S. H., & Brandenburg, A. 1999, ApJ, 524, 295 [NASA ADS] [CrossRef] [Google Scholar]
- Santos, N. C., Melo, C. H., James, D. J., et al. 2008, A&A, 480, 889 [NASA ADS] [CrossRef] [EDP Sciences] [Google Scholar]
- Schuler, S. C., Plunkett, A. L., King, J. R., & Pinsonneault, M. H. 2010, PASP, 122, 766 [NASA ADS] [CrossRef] [Google Scholar]
- Setiawan, J., Weise, P., Henning, Th., et al. 2008, in Precision Spectroscopy in Astrophysics, ed. N. C. Santos, L. Pasquini, A. C. M. Correia, & M. Romaniello, 201 [arXiv:0704.2145] [Google Scholar]
- Scargle, J. D. 1982, ApJ, 263, 835 [NASA ADS] [CrossRef] [Google Scholar]
- Schisano, E., Covino, E., Alcalá, J. M., et al. 2009, A&A, 501, 1013 [NASA ADS] [CrossRef] [EDP Sciences] [Google Scholar]
- Schröder, C., Reiners, A., & Schmitt, J. H. M. M. 2009, A&A, 493, 1099 [NASA ADS] [CrossRef] [EDP Sciences] [Google Scholar]
- Siegler, N., Muzerolle, J., Young, E. T., et al. 2007, ApJ, 654, 580 [NASA ADS] [CrossRef] [Google Scholar]
- Simon, T., & Patten, B. M. 1998, PASP, 110, 283 [NASA ADS] [CrossRef] [Google Scholar]
- Sneden, C. A. 1973, ApJ, 184, 839 [NASA ADS] [CrossRef] [Google Scholar]
- Sousa, S. G., Santos, N. C., Israelian, G., Mayor, M., & Monteiro, M. J. P. F. G. 2007, A&A, 469, 783 [NASA ADS] [CrossRef] [EDP Sciences] [Google Scholar]
- Sousa, S. G., Alapini, A., Israelian, G., & Santos, N. C. 2010, A&A, 512, A13 [NASA ADS] [CrossRef] [EDP Sciences] [Google Scholar]
- Soderblom, D. R., Jones, B. F., Balachandran, S., et al. 1993, AJ, 106, 1059 [NASA ADS] [CrossRef] [Google Scholar]
- Stauffer, J. R., Caillault, J.-P., Gagne, M., Prosser, C. F., & Hartmann, L. W. 1984, ApJS, 91, 625 [Google Scholar]
- Stauffer, J. R., Hartmann, L. W., Prosser, C., et al. 1997, ApJ, 479, 776 [NASA ADS] [CrossRef] [Google Scholar]
- Torres, C. A. O., Quast, G. R., de la Reza, R., et al. 2003, Astrophis Space Sci. Libr. Open Issues in Local Star Formation, ed. J. Lepine & J. Gregorio-Hetem (Kluwer Academic Publishers), 299, 83 [Google Scholar]
- Torres, C. A. O., Quast, G. R., da Silva, L., et al. 2006, A&A, 460, 695 [NASA ADS] [CrossRef] [EDP Sciences] [Google Scholar]
- Torres, C. A. O., Quast, G. R., Melo, C. H. F., & Sterzik, M. F. 2008, Handbook of Star Forming Regions, Volume II: The Southern Sky ASP Monograph Publications, ed. Bo. Reipurth, 5, 757 [arXiv:0808.3362] [Google Scholar]
- Triaud, A. H. M. J., Collier Cameron, A., Queloz, D., et al. 2010, A&A, 524, A25 [NASA ADS] [CrossRef] [EDP Sciences] [Google Scholar]
- Tripicchio, A., Severino, G., Covino, E., et al. 1997, A&A, 327, 681 [NASA ADS] [Google Scholar]
- Van Leeuwen, F. 2007, A&A, 474, 653 [NASA ADS] [CrossRef] [EDP Sciences] [Google Scholar]
- Van Leeuwen, F. 2009, A&A, 497, 209 [NASA ADS] [CrossRef] [EDP Sciences] [Google Scholar]
- Viana Almeida, P., Santos, N. C., Melo, C., et al. 2009, A&A, 501, 965 [NASA ADS] [CrossRef] [EDP Sciences] [Google Scholar]
- Voges, W., Aschenbach, B., Boller, Th., et al. 1999, A&A, 349, 389 [NASA ADS] [Google Scholar]
- Voges, W., Aschenbach, B., Boller Th., et al. 2000, ROSAT All-Sky Survey Faint Source Catalog, Max Plank Institut fur Extraterresstriche Physik, Garching [Google Scholar]
- Waite, I. A., Carter, B. D., Marsden, S. C., & Mengel, M. W. 2005, Publications of the Astronomical Society of Australia, 22, 29 [Google Scholar]
- Watson, C. A., Littlefair, S. P., Diamond, C., et al. 2010, MNRAS, submitted [arXiv:1009.4132] [Google Scholar]
- Weise, P., Launhardt, R., Setiawan, J., & Henning, T. 2010, A&A, 517, A88 [NASA ADS] [CrossRef] [EDP Sciences] [Google Scholar]
- White, R. J., Gabor, J. M., & Hillenbrand, L. A. 2007, AJ, 133, 2524 [NASA ADS] [CrossRef] [Google Scholar]
- Wichmann, R., Schmitt, J. H. M. M., & Hubrig, S. 2003, A&A, 399, 983 [NASA ADS] [CrossRef] [EDP Sciences] [Google Scholar]
- Winn, J. N., Fabrycky, D., Albrecht, S., & Johnson, J. A. 2010, ApJ, 718, L145 [NASA ADS] [CrossRef] [Google Scholar]
- Wright, J. T., Marcy, G. W., Butler, R. P., & Vogt, S. S. 2004, ApJS, 152, 261 [NASA ADS] [CrossRef] [Google Scholar]
- Wyatt, M. C. 2008, ARA&A, 46, 339 [NASA ADS] [CrossRef] [Google Scholar]
- Zimmermann, H. U., Becker, W., Belloni, T., et al. 1994, MPE report No. 257 [Google Scholar]
Appendix A: X-ray emission of IC 2391 members
Because the IC 2391 cluster extends over an area larger than the one considered in pointed X-ray observations and because several new members are considered, we summarize here the X-ray luminosities of the IC 2391 members selected from Torres et al. (2008). We collected the results of pointed observations with ROSAT (Patten & Simon 1996; Simon & Patten 1998) and XMM (Marino et al. 2005). We also cross-checked the Torres et al. (2008) membership list with the ROSAT all-sky bright and faint sources (Voges et al. 1999, 2000), adopting a matching radius of 30 arcsec. X-ray fluxes were derived using the calibration by Hünsch et al. (1999) and X-ray luminosities adopting the distances from Torres et al. (2008).
X-ray emission of IC 2391 members.
All Tables
Measurements of FEROS spectra. OS= Object+Sky OC=Object=Calibration (simultaneous thorium).
Summary of measurements of spectroscopic parameters of HD 61005 available in the literature.
Metallicity and [X/Fe] ratios for HD 61005, where errors represent uncertainties due to EWs.
All Figures
|
Fig. 1 The complete ASAS magnitude time series (top panel), together with a selection of time segments. In the left panels, we plot the time series magnitudes with an overplotted sinusoid (solid curve) of P = 5.04 d rotation period. In the middle panels, we plot the periodograms with indication of the 99% confidence level (horizontal dashed line) and the power peak corresponding to the rotation period. Finally, in the right panels we plot the phased light curves using the P = 5.04 d period and the first JD of the time segment as initial epoch. Here again the solid curve is the fitting sinusoid. |
| In the text | |
|
Fig. 2 Top panels: the periodogram (left) and the window function (right) obtained from the Lomb-Scargle analysis of the ASAS plus Hipparcos time series. Middle panel: Hipparcos + ASAS V band magnitude timeseries with an overplotted fitted sinusoid of P = 3.4 yr cycle. Bottom panel: V versus B − V measurements from Tycho (individual measurements as well as the binned values). |
| In the text | |
|
Fig. 3 Effective temperature derived with ARES on Sun spectra broadened artificially to various projected rotational velocities. Results are robust for vsini up to 18 km s-1. |
| In the text | |
|
Fig. 4 Left panel: spectral synthesis of the region around the Li 6708 Å doublet. Right panel: details of the Li doublet. Overplotted is our best-fit Li abundance (log n(Li) = 2.85; red short-dashed curve) while the dotted and long-dashed curves represent log n(Li) = 2.75 and log n(Li) = 2.95, respectively. |
| In the text | |
|
Fig. 5 MV vs. B − V, V − I and V − K color magnitude diagrams for HD 61005 (red star), IC 2391 open cluster (black filled circles; data summarized in Messina et al. 2010b), β Pic moving group (orange filled triangles, 10 Myr), Tucana, Carina and Columba associations (green filled squares, 30 Myr) and AB Dor moving group (blue filled, upside-down triangles, 70 Myr). For these associations, only the stars with trigonometric parallaxes among the members selected by Torres et al. (2008) were considered. The position of HD 61005 is compatible with a broad range of ages, older than about 20 Myr. |
| In the text | |
|
Fig. 6 Upper panels: U, V, and W space velocities for HD 61005 (red asterisk) and Argus members from the list of Torres et al. 2008. Square symbols refer to objects with trigonometric parallaxes. Lower panels: space positions X, Y, Z. Symbols as in the upper panels. |
| In the text | |
|
Fig. 7 Upper panel: distribution of rotation periods of Argus association (blue squares) and IC 2391 (black circles) members versus B − V color. Confirmed and likely periods are plotted with filled symbols, uncertain periods with open symbols. Data are taken from Messina et al. (2010b). HD 61005 is represented by the (red) star symbol. The dashed and dotted lines represent the upper bounds of the period distribution of Pleiades members (from Barnes 2003). |
| In the text | |
|
Fig. 8 Comparison of Li EW of HD 61005 (red filled star) with that of Argus association field stars (blue squares) and IC 2391 open cluster stars (black circles) Filled symbols refer to stars with confirmed or likely rotational period in Messina et al. (2010b), and open symbols to stars with uncertain or undetermined rotational period in Messina et al. (2010b). The dashed curve is the cubic fit to the locus of IC 2391 members in the range B − V = 0.50−1.10 |
| In the text | |
|
Fig. 9 Upper panel: residuals of Li 6708 EW with respect to mean locus vs. B − V defined by IC 2391 members plotted versus rotational period (dashed line in Fig 8). Filled and open (black) circles: IC 2391 stars with confirmed+likely and uncertain rotation periods, respectively; filled and open (blue) squares: Argus field stars, with confirmed+likely and uncertain rotation periods, respectively; (red) star: HD 61005. The continuous line represents the fit of IC 2391 members with confirmed rotational periods, and the dotted line represents the fit including the unconfirmed periods. Lower panel: residuals of Li 6708 EW with respect to mean locus vs. B − V defined by IC 2391 members plotted versus projected rotational velocity. Filled circles: IC 2391. Filled squares: Argus field. (Red) star: HD 61005. |
| In the text | |
|
Fig. 10 Distribution of log LX/Lbol of IC 2391 (filled circles), Argus association (blue filled squares), and Pleiades members (open squares and open triangles for detections and upper limits respectively; data taken from Stauffer et al. 1994) versus B − V colour. HD 61005 is plotted as a (red) star. A few IC 2391 members are not detected in X-ray. |
| In the text | |
|
Fig. 11 Abundances of individual elements of HD 61005 compared to those of IC 2391 (from D’Orazi & Randich 2009; and D’Orazi et al. 2009a). |
| In the text | |
Current usage metrics show cumulative count of Article Views (full-text article views including HTML views, PDF and ePub downloads, according to the available data) and Abstracts Views on Vision4Press platform.
Data correspond to usage on the plateform after 2015. The current usage metrics is available 48-96 hours after online publication and is updated daily on week days.
Initial download of the metrics may take a while.