Free Access
Fig. 4
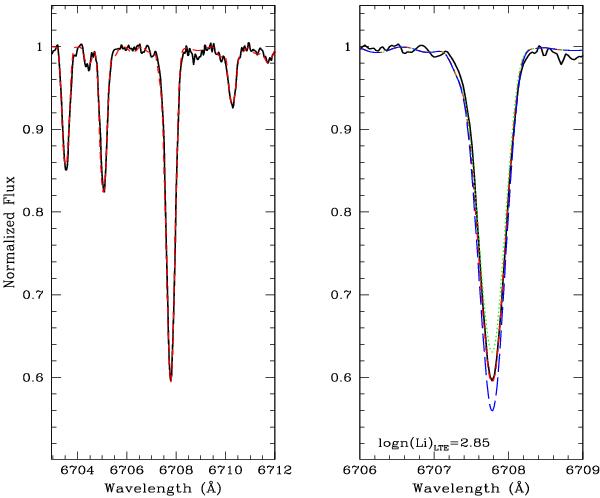
Left panel: spectral synthesis of the region around the Li 6708 Å doublet. Right panel: details of the Li doublet. Overplotted is our best-fit Li abundance (log n(Li) = 2.85; red short-dashed curve) while the dotted and long-dashed curves represent log n(Li) = 2.75 and log n(Li) = 2.95, respectively.
Current usage metrics show cumulative count of Article Views (full-text article views including HTML views, PDF and ePub downloads, according to the available data) and Abstracts Views on Vision4Press platform.
Data correspond to usage on the plateform after 2015. The current usage metrics is available 48-96 hours after online publication and is updated daily on week days.
Initial download of the metrics may take a while.