Fig. 6
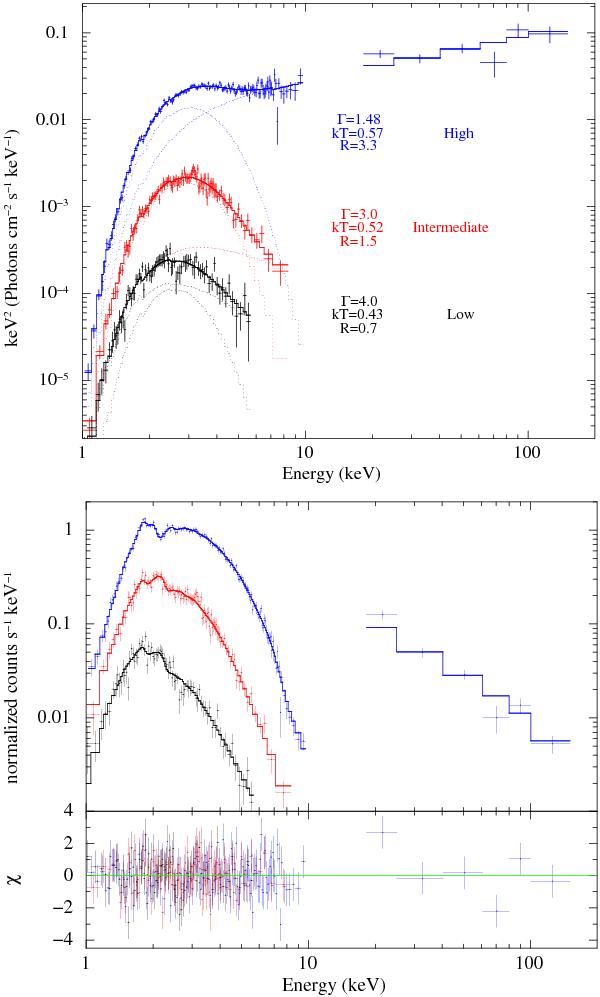
Upper panel: unfolded source spectra for observed intensity levels as modeled with the BB+PL model (best fit parameters are reported in Table 4). High (blue), intermediate (red) and low (black) intensity data are from the observation of Jan. 25, 2009 (Chandra ), Aug. 9, 2007 (XMM-Newton ), and Aug. 21, 2006 (XMM-Newton ) respectively. The high intensity spectrum is the only one for which an INTEGRAL (13–200 keV) pointing is available. Lower panel: the same as upper panel, but for count spectra (residuals are shown in the bottom panel).
Current usage metrics show cumulative count of Article Views (full-text article views including HTML views, PDF and ePub downloads, according to the available data) and Abstracts Views on Vision4Press platform.
Data correspond to usage on the plateform after 2015. The current usage metrics is available 48-96 hours after online publication and is updated daily on week days.
Initial download of the metrics may take a while.