Fig. 2
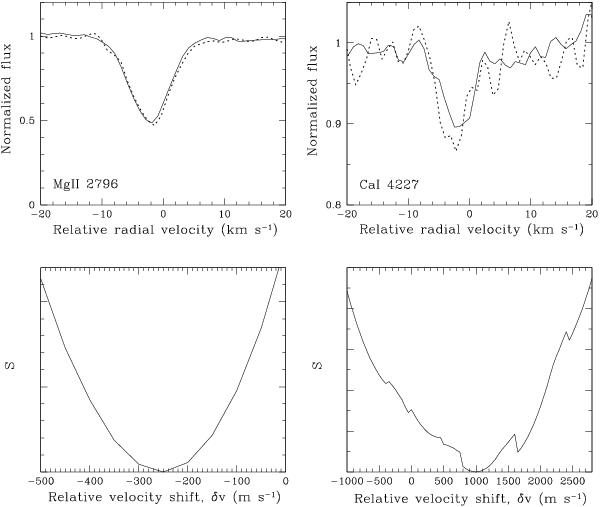
Cross-correlations of profiles from exposures with high signal levels. All lines are from the zabs = 0.45207 system. Left upper panel: solid line – the normalized Mg ii λ2796 Å profile composed from 12 exposures with similar signal levels (100–150 counts per pixel at the continuum level); dotted line – the normalized Mg ii λ2796 Å profile from the exposure #2, setting 437 (Table 1) with a high level of signal (~500 counts per pixel). Left lower panel:  as function of δv (same as in Fig. 1). The dotted line profile is to be shifted by ≈ −250 m s-1 to become fully aligned with the composite profile. Right upper panel: solid line – the normalized profile of the weak Ca i λ4227 Å line composed from eight exposures with similar signal (~300 counts per pixel); dotted line – the normalized Ca i λ4227 Å profile from the exposure #1, setting 760 (Table 1) with a high level of signal (~1000 counts per pixel). Right lower panel: as function of δv (same as in Fig. 1). The dotted line profile is distorted by noise, which leads to its apparent shift relative to the composite profile of about −1000 m s-1. The real shift of this portion of the exposure #1 is only −150 m s-1 as calculated from profiles of a strong Fe ii λ2382 Å line at zabs = 1.5864 located in the vicinity of Ca i λ4227 Å.
Current usage metrics show cumulative count of Article Views (full-text article views including HTML views, PDF and ePub downloads, according to the available data) and Abstracts Views on Vision4Press platform.
Data correspond to usage on the plateform after 2015. The current usage metrics is available 48-96 hours after online publication and is updated daily on week days.
Initial download of the metrics may take a while.