Fig. 1
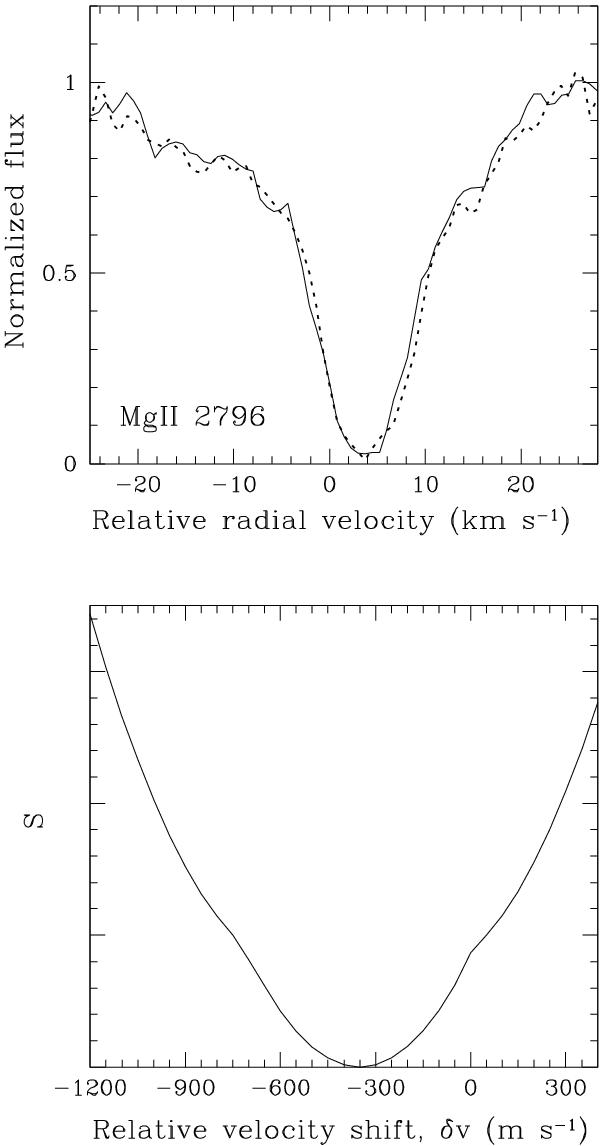
Example of the cross-correlation of two profiles from different exposures. Upper panel: normalized intensities of the Mg ii λ2796 Å line from the zabs = 1.5864 system (Sect. 4.2) extracted from exposure #2, setting 760 (solid line) and from exposure #1, setting 760 (dotted line). See Table 1. Lower panel: the dependence of  – the sum of squares of the intensity differences over all pixels covering the line profiles – as function of the velocity shift, δv. The profiles become fully aligned when the dotted line profile is shifted by ≈ − 350 m s-1 ( ≈ 1/4 pixel size).
Current usage metrics show cumulative count of Article Views (full-text article views including HTML views, PDF and ePub downloads, according to the available data) and Abstracts Views on Vision4Press platform.
Data correspond to usage on the plateform after 2015. The current usage metrics is available 48-96 hours after online publication and is updated daily on week days.
Initial download of the metrics may take a while.