| Issue |
A&A
Volume 529, May 2011
|
|
|---|---|---|
| Article Number | A113 | |
| Number of page(s) | 16 | |
| Section | Extragalactic astronomy | |
| DOI | https://doi.org/10.1051/0004-6361/201016192 | |
| Published online | 14 April 2011 | |
Radio structure of the blazar 1156 + 295 with sub-pc resolution
1
Shanghai Astronomical Observatory, CAS, 80 Nandan Road, 200030 Shanghai, PR China
e-mail: This email address is being protected from spambots. You need JavaScript enabled to view it.
2
Graduate University of the Chinese Academy of Sciences, 100049 Beijing, PR China
3
Harvard-Smithsonian Center for Astrophysics, 60 Garden Street, MS 78, Cambridge, MA 02138, USA
4
Joint Institute for VLBI in Europe, Postbus 2, 7990 AA Dwingeloo, The Netherlands
5
Institute of Space and Astronautical Science, Japan Aerospace Exploration Agency, 3-1-1 Yoshinodai Chuo-ku, Sagamihara, Kanagawa 252-5210, Japan
Received: 24 November 2010
Accepted: 14 February 2011
Abstract
Aims. 1156 + 295 is a flat-spectrum quasar that is loud at both radio and γ-ray wavelengths. Previous observations of the source revealed a radio morphology on pc to kpc scales consistent with a helical jet model. We carried out VLBA observations at centimeter and millimeter wavelengths to study the structure of the innermost jet and understand the relation between the helical structure and astrophysical processes in the central engine.
Methods. The source 1156 + 295 was observed with the VLBA at 86, 43, and 15 GHz at four epochs from 10 May 2003 to 13 March 2005. The observations were carried out in a full polarization mode. The highest resolution of the observations is 0.08 mas (~0.5 pc) at 86 GHz.
Results. A core-jet structure with six jet components is identified in 1156 + 295. Three jet components are detected for the first time. The apparent transverse velocities of the six jet components derived from proper motion measurements range between 3.6 c and 11.6 c, suggesting that highly relativistic jet plasma moves in the direction close to the line of sight. The overall jet has an oscillating morphology with multiple curvatures on pc scales, which might be indicative of a helical pattern. Models of a helical jet are discussed in the context of both Kelvin-Helmholtz (K-H) instability and jet precession. The K-H instability model is in closer agreement with the observed data.
Conclusions. The overall radio structure on scales from sub-pc to kpc appears to be fitted with a hydrodynamic model in the fundamental helical mode of Kelvin-Helmholtz (K-H) instability. This helical mode with an initial characteristic wavelength of λ0 = 0.2 pc is excited at the base of the jet on the scale of 0.005 pc (or 103Rs, the typical size of the broad line region of a supermassive black hole of 4.3 × 10⁸ M⊙). A precessing jet model can also fit the observed jet structure on scales of between 10 pc and 300 pc. However, with the precessing jet model, additional astrophysical processes may be required to explain the bendings of the inner jet structure (1 to 10 pc) and re-collimation of the large-scale jet outflow (>300 pc).
Key words: galaxies: jets / galaxies: kinematics and dynamics / quasars: individual: 1156 + 295 / radio continuum: galaxies
© ESO, 2011
1. Introduction
Radio-loud AGNs have been observed for more than three decades, and tremendous progress has been made in understanding the underlying physical processes with detailed modeling (e.g. Urry & Padovani 1995). However, many fundamental and important problems remain uncertain. For example, it is unclear how the jets are formed, accelerated, and collimated, and what causes the broad range of observed morphologies of jets. The detailed observations of structures, polarizations, and proper motions of jets on parsec and sub-parsec scales will provide critical insight into how the observed morphologies of radio jets are related to the dynamic processes of radio outflows and accretion disks around single, perhaps binary, supermassive black holes. The millimeter VLBI appears to be a unique tool to image the extremely compact region of radio sources associated with AGNs at the resolution of sub-milliarcsecond, providing a wealth of information about the detailed jet physics.
The blazar 1156 + 295 (z = 0.729) is an archetypal radio-loud AGN with a prominent jet. It is variable across the entire spectrum. Strong γ-ray flares have been detected by EGRET and Fermi at energies higher than 100 MeV (Thompson et al. 1995; Mukherjee et al. 1997; Hartman et al. 1999; Abdo et al. 2009). In the optical domain, the source has been classified as an optically violent variable (OVV) source and highly polarized quasar (HPQ) (Wills et al. 1983, 1992; Glassgold et al. 1983). In the radio domain, 1156 + 295 displays a significant variability on timescales from years to days (e.g. see the monitoring program of the University of Michigan Radio Astronomy Observatory1 and the calibration program of the NRAO Very Large Array2, Lovell et al. 2003; Savolainen & Kovalev 2008).
Observation log.
On a wide range of linear scales from pc to kpc, the source has a “core-jet” structure. The jet is curved and consists of several bright knots. On pc scales, the jet initially points to the north and then bends to the northeast at a distance of 3 − 4 mas from the core. At about 25 mas from the core, the jet then bends northwest and aligns itself with the initial direction of the kpc-scale jet. On the kpc scales, the jet has a wiggling morphology around a mean position angle of –18° and terminates at a hotspot 2 arcsec north of the core (Hong et al. 2004). On the basis of the high apparent super-luminal velocities (up to 15 h-1c, where h is the Hubble constant in units of 100 km s-1 Mpc-1, McHardy et al. 1990), VLBI jet components, and ultra-high brightness temperatures (>1012 K) of the core component (Piner & Kingham 1997; Jorstad et al. 2001; Hong et al. 2004), the angle between the jet axis and the line of sight is quite small. The complex bending jet can be attributed to the projected shape of a 3-D helical jet (Hong et al. 2004), which appears to be common in radio-loud AGNs (see Conway & Murphy 1993).
To identify the relation between the wiggling jet and the activity of the central engine on sub-pc scales, we conducted 4-epoch VLBI observations of 1156 + 295 at three frequencies of 86, 43, and 15 GHz (3 mm, 7 mm, and 2 cm, respectively). On the basis of observed morphologies, structural variations, and polarization properties, kinematic models based on different physical mechanisms are presented. Cosmological parameters of H0 = 71 km s-1 Mpc-1, ΩM = 0.27, and ΩΛ = 0.73 are used throughout this paper. At the distance of 1156 + 295, 1 mas corresponds to 7.3 pc, and a proper motion of 1 mas yr-1 corresponds to 23.7 c (Wright 2006).
2. Observations and data reduction
The multi-frequency observations were carried out with the Very Long Baseline Array (VLBA) on 10 May 2003 (2003.36), 24 July 2003 (2003.56), 1 April 2004 (2004.25), and 13 March 2005 (2005.19) at 86, 43, and 15 GHz. Detailed information about the observations is given in Table 1.
We used a snapshot observing mode (one scan of 4−5 min duration) for our main target source and calibrators. To optimize the u-v coverage, the three observing frequencies of 86, 43, and 15 GHz were cycled in each of the observing runs. A pointing scan was inserted after each of the frequency switching to 86 GHz. A total observing time around 6 h on 1156 + 295 was evenly allocated to three observing frequencies at each epoch.
All observations were made in the dual circular-polarization mode. At 15 and 43 GHz, 3C273, J1310 + 3220 and OJ 287 were included in the observing runs as calibrators for corrections for R-L delay-offset, polarization leakage, and the absolute position angle of the electric vector (EVPA), respectively. At 86 GHz, it is difficult to find a compact calibrator with a stable polarization angle to use for EVPA calibration, hence we only study the total intensity structure of 1156 + 295 from the 86 GHz data. The raw data were recorded in the 2-bit VLBA format with a total bandwidth of 64 MHz and correlated in Socorro, New Mexico, USA.
The data were reduced following the standard procedure of VLBA data reduction using the NRAO AIPS (Astronomical Image Processing System) software package (Diamond 1995). The visibility amplitudes were calibrated using the gain curves and system temperature monitored during the observations. The atmospheric opacity correction was applied by using the WX table, which is an extension file of data in a table format containing ground weather information. Fringe fitting was made using a short scan on 3C 273 to calibrate the delays and phases. The solutions were then interpolated to the data on all the programme sources. Global fringe fitting was carried out to help correct for the residual delays and fringe rates. At 15 and 43 GHz, 3C 273 and OJ 287 were used to calibrate the complex bandpasses.
A series of polarization-specific calibrations were made for the 15 and 43 GHz data. After the amplitude calibration, variations in the parallactic angles were determined and removed from the data. The R-L delay difference was determined by running the VLBA procedure VLBACPOL on the highly polarized source 3C 273. The instrumental polarization parameters of the antenna feeds were calibrated with the AIPS task LPCAL using scans on J1310 + 3220. The corrections were written in an updated antenna (AN) table and then applied to the data. The calibration of the absolute polarization angle was made from observations of OJ 287 or J1310 + 3220. At 15 GHz, we used OJ 287, which is compact and stable enough to be an EVPA calibrator. To obtain the EVPA correction, we compared its apparent EVPA with the near-simultaneous measurements included in the MOJAVE/2cm Survey database3. At 43 GHz, both OJ 287 and J1310+3220 were used for similar calibrations. Corrections were derived by comparing their apparent EVPA with the VLA/VLBA measurements4 at 43 GHz on close epochs. After calibration, the data were divided into single-source files and imported into the Caltech VLBI Program DIFMAP (Shepherd et al. 1994) for self-calibration and imaging. The fully calibrated data at 15 and 43 GHz were then re-imported into AIPS to generate polarization images. I,Q, and U images were produced separately with the AIPS task IMAGR using natural weighting. The polarization angle and polarization intensity images were then obtained by combining the Q and U images using the AIPS task COMB.
At 86 GHz, an antenna-based edition of the data was first produced in DIFMAP to remove visibilities related to extremely large amplitude fluctuations likely due to bad weather or imperfect atmospheric opacity corrections. The uv data were then averaged using Miriad (Sault et al. 1995) over a time span of 1 min. We calculated the scalar average in amplitude because the 86-GHz visibility phase is significantly affected by fast atmospheric path length changes. After that, the non-imaging analysis was done in the uv-domain (see Sect. 3.1.3). Finally, the 86-GHz data were re-imported into DIFMAP for self-calibration and imaging. The image at 86-GHz was made with uniform weighting to achieve a higher angular resolution. A few iterations of phase-only self-calibration were made until the rms noise in the image did not decrease. Amplitude self-calibration was not performed because we found that it would cause an uncertainty as large as 20 − 30 percent in the flux density at 86 GHz.
3. Results and analysis
3.1. Structure of the source 1156 + 295
3.1.1. Images at 15 and 43 GHz
The contour images in Figs. 1 and 2 represent the distribution of total radio intensity in 1156 + 295 at four epochs at 15 and 43 GHz, respectively. The parameters of the images are listed in Table 2.
In the images at 15 GHz, the peak values of the intensity are 1.61, 1.86, 0.46, and 1.31 Jy beam-1 for the four epochs, respectively. At 43GHz, the values are 1.54, 2.22, 0.44, and 1.59 Jy beam-1, respectively. The peak value at the highest epoch (2003.56) is four or five times as high as at the lowest epoch (2004.25). This large variation in peak intensity is not due to calibration error, but reflects an intrinsic variation in the source. The similar trend in the flux density variation is seen in the flux density monitoring program at centimeter and millimeter wavelengths (e.g. VLA: 5, 8.4, 22, and 43 GHz, Motsähovi: 22 and 37 GHz, OVRO MMA:110 GHz), confirming that the source started flaring around epoch 2003.3, reached the peak around epoch 2003.6 and at higher frequencies earlier, and that the total flux density decayed rapidly to its minimum value around epoch 2004.4. The next flare appeared to reach its peak around 2005.4.
In 15 GHz images, the source has a compact and bright region (referred to as the “core” hereafter) that dominates the brightness distribution and has a one-sided jet to the north. The jet initially extends to the northeast, bends to the northwest and becomes a diffuse structure at a distance of 3 − 4 mas from the core. At about 12 mas from the core, the brightness of the jet drops below the detection limit of 0.6 mJy beam-1 (3σ). The overall structure of 1156 + 295 observed at 15 GHz is in good agreement with the previous observations at lower frequencies (Hong et al. 2004; Piner & Kingham 1997; Jorstad et al. 2001).
At 43 GHz, with an angular resolution of 0.2 mas (corresponding to 1.5 pc, and close to the size of the broad line region of a normal AGN), our observations reveal a core-jet structure on a scale smaller than 1 mas (7.3 pc). The jet first extends to the north in the innermost 0.5 mas, then bends to the north-east along the direction at PA ~ 18° with respect to the core. The morphology is consistent with the structure observed at 15 GHz.
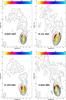 |
Fig. 1 The four epochs of VLBA images of 1156 + 295 at 15 GHz. The contour maps represent Stokes I images. The pseudo-color maps overlaid on contours represent the distribution of fractional polarization in which linear polarization intensity above 4σ is shown. The length of the short bars represents the strength of the polarized emission, 1 mas ~ 1.0 × 10⁻² Jy beam-1. The orientation of the short bars represent the apparent electric vector position angle (EVPA) without a rotation measure correction. The detailed parameters of the images are listed in Tables 2 and 7. |
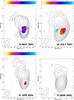 |
Fig. 2 The four epochs of VLBA images of 1156 + 295 at 43 GHz. The contour and pseudo-color maps are similar to those in Fig. 1. The length of the short bars represents the strength of polarized emission, 1 mas ~ 4.0 × 10⁻² Jy beam-1. The orientation of the short bars present the apparent EVPA without rotation measure correction. The detailed parameters of the images are listed in Tables 2 and 7. |
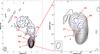 |
Fig. 3 The fitted models are overlaid on the clean images of 15 and 43 GHz on epoch 2003.36 to indicate their positions and intrinsic size. |
15 GHz model-fitting results and physical parameters of fitted models.
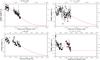 |
Fig. 4 Estimating the flux density (Sf) and size (θd) of the source using the brightness distribution models introduced by Pearson (1995): for the first three epochs, an extended source model could be used, whereas for the last epoch, a double-point source model with an intensity ratio of 3:1 and an angular separation of 0.16 mas were used. |
43 GHz model-fitting results and physical parameters of fitted models.
3.1.2. Model fitting of data at 15 and 43 GHz
To quantitatively analyze the properties of 1156 + 295, we fitted the source emission structure with Gaussian components using the program MODELFIT in DIFMAP. The model-fitting parameters are listed in Tables 3 and 4 for 15 and 43 GHz, respectively.
At 15 GHz, in addition to four sets of 15 GHz data described in Section 2, three additional data sets for epochs 2001.17, 2002.90, and 2004.11 from the “MOJAVE 2cm Survey Data Archive” are used in the model fitting. The source structure is most closely fitted with six Gaussian components (see the left panel of Fig. 3) at this frequency. The brightest region (component C) could be fitted with the elliptical Gaussian component that was considered to be the core in the previous works (Hong et al. 2004). The jet is fitted with five circular Gaussian components, which are named “C2” to “C6” following the nomenclature in Hong et al. (2004). The component C5 was first detected at the epoch 2001.17 with a flux density of 115.3 mJy at a distance of ~0.7 mas in PA ~ 13°. Its flux density dropped quickly to about 10% of its initial value at the epoch 2005.19 and the size of the component expanded slightly as C5 moved out from the core. C6 was first detected at the epoch 2003.36 with a flux density of 188.5 mJy. In comparison to C5, both the size and flux density of C6 varied relatively slowly as it moved out from the core.
At 43 GHz, in the first three epochs (2003.36, 2003.56, and 2004.25), both C5 and C6 were detected. In addition, C7, the closest component to the core was detected (see the right panel of Fig. 3). All the components C5, C6, and C7 were detected for the first time at the epoch of 2003.36 at this frequency. We found C6 varied significantly and the variation in the flux density at 43 GHz appeared to be correlated with that observed at 15 GHz. We also note that from 2003.36 to 2003.56, the apparent flux density of C7 increased by a factor of 2.3 and the apparent size increased by a factor of 2.7. The possible reason for the rapid increase in the radiation intensity of C7 is the absence of the SC (San Croix) antenna which decreases the resolution and causes an increase in the apparent size, hence the apparent flux density of C7. In the fourth epoch (2005.19), only two components were detected because of the relatively poorer sensitivity and angular resolution in the absence of two VLBA antennas (HN and SC); the data were fitted with two Gaussian components.
3.1.3. The visibility analysis and images of 86 GHz data
We inspected the visibility amplitude of 86 GHz data as a function of the projected baseline to acquire a general idea of the source structure. The visibility amplitude profiles are not in consistent with the expectations for a simple point source, but there is some evidence of intrinsic source structures.
We fitted the amplitude profiles on three different baseline length ranges, the shortest (60 − 70 × 106λ), intermediate (100−200 × 106λ), and longest (1100−1500 × 106λ), with a point source model, respectively. The correlated flux density on the shortest baselines (Ss) is 1.5, 1.6, 0.8, and 0.7 Jy at epoch 2003.36, 2003.56, 2004.25, and 2005.19, respectively (see Table 5), suggesting a flux density variation on a timescale of years to months (the shortest time separation being 2.4 months). The largest variation accounts for a factor of 2.3. The trend in the flux density variation observed at 86 GHz agrees with that seen for the 15 and 43 GHz observations at these epochs, and the variations in flux density reported from the monitoring program at centimeter and millimeter wavelengths (see Sect. 3.1.1). The correlated flux densities on the intermediate baseline (Sm) and longest baseline (Sl) are lower than Ss, providing evidence that the source structure at 86 GHz is resolved by the VLBA at these epochs.
We then use the brightness distribution models introduced by Pearson (1995) to estimate the flux density (Sf) and size (θd) of the source. For the first three epochs, an extended source model can be used (see Fig. 4). The calculation gives the flux density 1.7, 1.8, and 0.8 Jy, respectively, and the largest size of the source 0.06 mas (2003.36), 0.05 mas (2003.56), and 0.05 mas (2004.25), respectively (see Table 5). For the first three epochs, the correlated flux density on the shortest baseline (Ss) is comparable to the fitted Gaussian peak of the amplitude profile, implying that Ss is a reasonable representative of the zero-spacing flux density. For the last epoch (2005.19), a double-point source model was used (see Fig. 4). The flux density is 0.9 Jy, the flux density ratio of two point sources is 3:1, and the separation of the two point components is 0.16 mas (see Table 5).
On 86 GHz CLEANed images (see Fig. 5), most of the jet emission is resolved out at an angular resolution of 0.2 mas × 0.08 mas. At the epoch 2003.36, a weak jet is seen ~0.3 mas north of the core. The 86 GHz jet coincides with the innermost jet component C7 detected at 43 GHz at the same epoch. Earlier work, based on Global Millimeter VLBI Array observations on 26 October 2001 at 86 GHz with an angular resolution of 0.188 × 0.038 mas, detected a jet component at 0.19 mas north of the core, marginally coinciding with C7 in our observations. At all other three epochs of 2003.56, 2004.25, and 2005.19, the jet emission on scales of between 0.1 and 1 mas detected at both 43 and 15 GHz is below the detection threshold at 86 GHz (i.e., 3σ ≃ 30 mJy beam-1), showing only a point-like source in 1156 + 295.
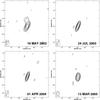 |
Fig. 5 The four epochs VLBA images of 1156 + 295 at 86 GHz. The detailed parameters of the images are listed in Table 6. |
86 GHz parameters from model fitting of amplitude profiles.
3.2. Flux variability of the core component
The radio emission of the source is dominated by the compact core at all three observing frequencies of our experiment. The variability of the core component C at each frequency can be assessed using the index of variability V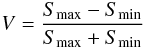 (1)where Smax and Smin are the maximum and minimum fitted flux densities of the core component. A value of V ~ 0 represents no variability and V ~ 1 extreme variability. During the observing period, V was 0.58 ± 0.07, 0.64 ± 0.06, and 0.39 ± 0.13 for 15, 43, and 86 GHz, respectively, suggesting that the component C is highly variable (the uncertainties in V are evaluated based on the uncertainties in the Smax and Smin).
The core of an AGN is often defined to be the most compact region of the jet or the jet base, which always appears to be optically thick at centimeter wavelengths because of the superposition of sub-sections of the inner jet with various synchrotron self-absorption turnover frequencies. At millimeter wavelengths, many quasars and AGNs display a spectral turnover at 1011 ± 0.5 GHz (32 − 320 GHz) (Marscher 1995). In this frequency range, the inner jet becomes optically thin, allowing us to observe the intrinsic source structure with VLBI at mm-submm wavelengths. Figure 6 shows the flux density of the core at three frequencies at each of four epochs. It shows that at the epochs 2003.56 and 2005.19, the flux density at 43 GHz dominates over those at 15 and 86 GHz, implying that the turnover frequency is around 43 GHz.
3.3. Superluminal motion of jet components
The angular distances to the core of all detected jet components were measured at all observing epochs. We carried out linear regression fitting of the separation of the jet components from the core as a function of the observing epoch. From the fitted slope of the linear regression, we determined the apparent velocities of each jet component.
The uncertainty in the separation of jet components to the core component C is estimated to be  (for the compact components from C4 to C7), or
  (for extended components C2 and C3), where W is the FWHM of the synthesized beam, a is the major-axis size of the component, and SNR is the signal-to-noise ratio for a given component (Fomalont 2004; Lee et al. 2008).
To better determine the proper motions of the components C2, C3, and C4, in addition to the data discussed in the present paper, we also included published data at lower observing frequencies at the early epochs (Hong et al. 2004). For components C5 and C6, both 15 and 43 GHz data from this work were used in the analysis. Since C7 can be separated from the core emission at only 43 GHz, the determination of the proper motion for C7 involves only the 43 GHz data from this paper.
We use the inverse square of the uncertainty, (1/(Δr)2), as a weight parameter in the least squares fitting for C2, C3, C4, and C7. For C5 and C6, we used both 15 and 43 GHz data points in the least squares fitting. The inverse square of the difference between the fitted positions at 15 and 43 GHz was used as a weight parameter.
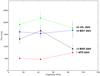 |
Fig. 6 A spectral plot of the core component at the four epochs. The error bars show errors in the measurement of the flux density of the core component. |
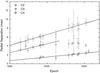 |
Fig. 7 The proper motions of the outer jet components C2, C3, and C4 are 0.49 ± 0.03 mas yr-1, 0.41 ± 0.08 mas yr-1, and 0.18 ± 0.03 mas yr-1, which correspond to 11.6 ± 0.7 c, 9.7 ± 1.9 c, and 4.3 ± 0.7 c, respectively. |
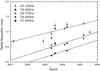 |
Fig. 8 The proper motions of inner jet components C5, C6, and C7 are 0.15 ± 0.02 mas yr-1, 0.19 ± 0.02 mas yr-1, and 0.16 ± 0.04 mas yr-1, which correspond to 3.6 ± 0.5 c, 4.5 ± 0.5 c, and 3.8 ± 0.9 c, respectively. |
Figures 7 and 8 illustrate the linear fit of the angular separation of the jet components for the determination of their proper motions. Significant proper motions of 0.49 ± 0.03, 0.18 ± 0.03, 0.15 ± 0.02, 0.19 ± 0.02, and 0.16 ± 0.04 mas yr-1 were determined for the jet components C2, C4, C5, C6, and C7, respectively. The apparent transverse velocities of 11.6 ± 0.7 c, 4.3 ± 0.7 c, 3.6 ± 0.5 c, 4.5 ± 0.5 c, and 3.8 ± 0.9 c derived from the proper motions for C2, C4, C5, C6, and C7, respectively, confirming early results on apparent superluminal motion in the blazar 1156 + 295 (Hong et al. 2004). We note that C3 shows a peculiar pattern in its proper motion. The fitting to the data before 2001 gives a proper motion of 0.41 ± 0.08 mas yr-1 (or 9.7 ± 1.9c). No significant proper motions was detected after 2001.17 when the component reached the place where the jet changes its direction by ~0°. Both the proper motion velocities and the component sizes of the jet components show an increase beyond a distance > 2 mas (or 14 pc) away from the core. A possible explanation of these changes is a decrease in the external pressure gradient.
Linear polarization properties at 15 and 43 GHz.
We also note that the inferred values of apparent speed for C4, C5, C6, and C7 are similar, and the apparent speeds of C2 and C3 are much higher than those of C4 to C7. A possible explanation is that the extended components C2 and C3 are rather diffuse, and the surface brightness of these components is very low. The uncertainty in the radial distance from the core is large and might affect the fitting value of the apparent speed.
3.4. Physical properties of compact components in VLBI images
The brightness temperature in the parent-galaxy rest-frame Tb can be derived from the measurements of the flux density (Sob), the observing frequency (νob), and the angular size (θd) after correction for the cosmological expansion effect (1 + z) (Güijosa & Daly 1996) 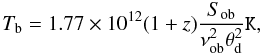 (2)where Sob is in Jy, νob in GHz, and θd is in mas. In our paper,
  for a Gaussian component with major (a) and minor (b) axis sizes at 15 and 43 GHz.
The derived results of Tb are summarized in the Col. 9 of Tables 3 and 4, and Col. 7 of Table 5. For some epochs at 15 and 43 GHz, we note that the observed brightness temperature Tb of the core component is close to or exceeds the upper limit of Tb restricted by the “inverse Compton catastrophe” (Kellerman & Pauliny-Toth 1969) or equipartition limit (Readhead 1994). The higher brightness temperature ≳ 1012 K in flat-spectrum radio sources is often considered to be a result of the Doppler boosting effect and /or indications on a non-stationary process.
We note that at the epochs 2003.36 and 2003.56, the brightness temperatures at 86 GHz are much lower than that measured at 43 GHz. This phenomenon seems to be common in flat-spectrum radio-loud quasars and AGNs (Lee et al. 2008; Lobanov et al. 2000). Since 1156 + 295 is still rather compact at 86 GHz, e.g. the ratio of the CLEANed flux density to the correlated flux density is approximately equal to 1 in our observations. Therefore, the relatively lower Tb at 86 GHz is not caused by the loss of compactness (Lee et al. 2008) but may be caused by the intrinsic changes in the physical conditions of the innermost jet (<0.04 mas, or 0.30 pc), e.g. the emission structure becomes optically thin at 86 GHz and the brightness temperature is intrinsically lower than the optically thick case.
To estimate the Doppler factor of 1156 + 295 using the results of our observations, we assume the equipartition of the energy between the radiating particles and the magnetic field. The equipartition Doppler factor of a uniform self-absorbed source can be obtained from Eq. (4) in Güijosa & Daly (1996) if we assume that the emission arise from an optical-thin, homogeneous sphere, ![Mathematical equation: \begin{eqnarray*} \delta_{\rm eq}&=&\Bigg[\left[10^3 F(\alpha)\right]^{34}\{[1-(1+z)^{-1/2}]/(2h)\}^{-2} S^{16}_{\rm op}\theta^{-34}_d \\ && \quad\times (1+z)^{15-2\alpha}(\nu_{\rm op}\times 10^3)^{-(2\alpha+35)}\Bigg]^{1/(13-2\alpha)} \end{eqnarray*}](/articles/aa/full_html/2011/05/aa16192-10/aa16192-10-eq154.png) where h is the Hubble constant in units of 100 km s-1 Mpc-1, the spectral index α is assumed to be –0.75, and θd is the angular diameter of the homogenous sphere in mas. For elliptical Gaussians,
where h is the Hubble constant in units of 100 km s-1 Mpc-1, the spectral index α is assumed to be –0.75, and θd is the angular diameter of the homogenous sphere in mas. For elliptical Gaussians,  , where a is the major axis size and b is the minor axis size. In addition, νop is the turnover frequency in GHz. To simplify the assessment, we used the observing frequency 15 and 43 GHz for replacing the turnover frequency. The data at 86 GHz are not used here because the source might be transparent to the synchrotron emission at this frequency. Thus, a higher limit to the equipartition Doppler factor is inferred from our estimate, where Sop is the flux density in Jy at the turnover frequency. In this paper, we use the observed flux density at 15 and 43 GHz as the Sop. F(α) is a factor with a value approximately equals to 3.4 at the turnover frequency.
The results are listed in column 10 of Tables 3 and 4. The values of the inferred Doppler factor are in the range of 1.3 to 16.5 except for the epoch 2004.25 when the source is in the lowest state.
Since δeq strongly depends on the observed values of Sop, νop, and θd, the difference between the values of δeq at different frequencies for a given epoch are dominated by the error in the observed quantities. The intrinsic brightness temperature eliminating the Doppler boosting in the source rest-frame is Tr, and Tr = Tb/δ. Assuming δ = δeq, we can estimate the value of Tr.
The inferred physical quantities of Tb, δeq, and Tr are summarized in Tables 3–5.
The kinematic properties (the Lorentz factor γ, the viewing angle θ, and the intrinsic velocity β in the unit of c) for the compact components C4 to C7 (the components C2 and C3 appear too extended to have meaningful assessments for the kinematic properties) in the inner jet region are discussed on the basis of Eqs. (3–5) given in Ghisellini et al. (1993)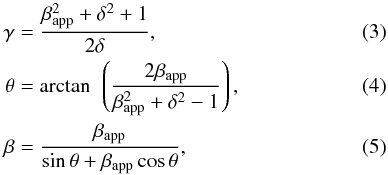 where
where  is the apparent proper motion velocity of jet components derived by linear fitting in Sect. 3.3 and δ is the Doppler factor with a value derived from the equipartition calculation δeq.
The inferred Lorentz factor ranges between 3.8 and 8.8, the viewing angle ranges between 1.5° and 24.7° (see Tables 3 and 4), and the intrinsic jet speed β approximately equals to 0.98 c. The jet properties inferred from the kinematic quantities confirm that 1156 + 295 is a source affected by the extreme relativistic-beaming effect.
3.5. Linear polarization properties of 1156 + 295
Figures 1 and 2 show the linear polarization structure of 1156 + 295 at 15 and 43 GHz, superimposed on the contour maps of total intensity at the corresponding frequencies. The polarization properties of the source, the polarized flux density Fpol, peak polarization intensity Fpeak, the fractional polarization m, and average EVPA are given in Table 7.
At 15 GHz, for the first three epochs (2003.36, 2003.56, and 2004.25) there is consistent structure in polarized emission. In the inner part of the structure, we probably see the polarized emission located in the areas of the core C, component C6 and C7. In the core, the fractional polarization m is in the range from 2.0% to 3.6%, and the average EVPA is about 110°. The jet component C5 shows a higher fractional polarization in the range form 6.0% to 6.7%, and an average EVPA ~ 75°. At the last epoch 2005.19, the polarization structure appeared to differ considerably from that observed during the previous three epochs. The average EVPA is about 44° and m ~ 4.8% for the core. The change in the polarized emission structure might be correlated with the total flux density variation as a result of the ejection of new jet components. The enhanced polarization in C5 can be explained as the result of a compression of the magnetic field in this region. The compression might be caused by shocks produced by newly ejected synchrotron plasma from the core. Under the compression conditions, the orientations of electron vector in C5 become closer to the direction of the jet flow.
At 43 GHz, we imaged the polarization structure on a scale smaller than 1 mas at three epochs 2003.36, 2003.56, and 2004.25. The polarized emission near the core region at 43 GHz is shown in Fig. 2. At the epoch 2003.36, the polarization properties observed at 43 GHz are consistent with those at 15 GHz, namely EVPA ≈ 120° and m ≈ 2.4%. In the second (2003.56) and third (2004.25) epochs, the fractional polarization is about 2.7% and 1.8%, respectively, but EVPA changes to 45° and 72°. The uncorrelated variation in polarization parameters between 43 and 15 GHz close to the flare epoch suggests that the radio activity associated with the flare was embedded within a zone that became transparent at 43 GHz but was still optically thick at 15 GHz at the epochs 2003.56 and 2004.25. After expansion, the active zone became optically thin at 15 GHz at the epoch 2005.19, as indicated by the significant changes in the polarization properties.
4. Helical jet structure
Parsec-scale jets in extragalactic radio sources are often misaligned with their kilo-parsec counterparts and show complex, in some cases “oscillating” structure, e.g., 3C 273 (Zensus et al. 1988; Conway & Murphy 1993). A three-dimensional helical pattern is often used to explain the phenomenology of oscillating parsec-scale jets. In particular, bright knots might represent the locally brighter region in the jet flow caused by enhanced Doppler boosting effects in a helical pattern. Induced helical bending in jets appear to be common in radio galaxies and flat-spectrum quasars (Conway & Murphy 1993; Taylor et al. 1996; Pearson et al. 1998; Lobanov et al. 2001).
Theoretical interpretations of helical jets include hydrodynamic instabilities (e.g. Hardee 1986, 1987) and/or precessing jets (e.g. Begelman 1980; Lindfield et al. 1981).
In the hydrodynamic instability models, the helix might be triggered by small perturbations in the accretion flow or random perturbations, such as jet-cloud collisions at the onset of the jet. The initial perturbations can be amplified by Kelvin-Helmholtz (K-H) hydrodynamic instability. Under certain circumstances, the instability develops into helical modes downstream to form the smoothly oscillating jet seen in 2-D images. The actual evolution of the instability in the jet flow depends on the fluctuation properties of the initial perturbations, the dynamics of the jet flow, and the properties of the surrounding interstellar medium (Hardee 1987, 2003).
In the precessing models, the helical jet trajectory is a superposition of ballistically moving jet knots that are for example ejected along periodically varying directions because of the precession of the jet nozzle. This precession might have been caused by the disturbance of the jet axis by a secondary black hole in a binary black hole system (Begelman 1980), or from interactions between the wobbling accretion disk and the spinning black hole (Liu &Melia 2002).
In the following subsections, we analyze the jet structure of 1156 + 295 in the context of both possible scenarios.
4.1. Hydrodynamic instabilities
A helical pattern can be produced by small perturbations in the jet flow by a hydrodynamic instability under certain circumstances. A dispersion relation describing the behavior of the harmonic components of the perturbation has been derived from a Fourier expansion of a cylindrical jet (Hardee 1987). A particular resonant mode can grow from any perturbations in a jet flow via K-H instability (e.g. Zhao et al. 1992).
To compute the oscillating jet trajectory in 1156 + 295 from sub-pc to pc scales, we introduced a kinematic helical model on the basis of case 2 from Steffen et al. (1995). This model corresponds to the helical jet model derived by Hardee (1987) based on the assumption of an isothermal and adiabatic expanding jet. For a cylindrical jet, Hardee (1987) showed that the jet distortions will grow in a way primarily associated with the helical fundamental mode n = 1 and therefore produce a helically twisted pattern on the jet’s surface. The helical jet can propagate to a rather long distance, i.e., 100 times the radius of the jet, prior to the disruption of the jet collimated flow (Hardee 1979, 1986, 1987). Under a relativistic approach, Steffen et al. (1995) calculated the a 3-D helical trajectory of the jet motion and assumed the bright knots in the helical jet are enhanced by Doppler boosting, where the jet plasma is likely to be either compressed or shocked.
Assuming that the kinetic energy, the specific momentum component along the jet axis, and the opening half angle of the jet all remain constant, the jet trajectory of the jet motion can be described by the equations of Steffen et al. (1995) in a cylindrical coordinate system 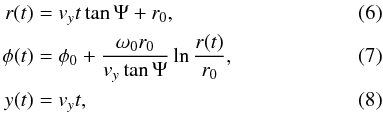 where r, φ, and y are the distance along the perpendicular jet axis, the azimuth angle, and the height along the jet axis, respectively. We note that the notation z, the distance along the jet axis, in Steffen et al. (1995) has been replaced by y, and is not to be confused with the cosmological redshift z. The coordinates with the subscript “0” (r0, φ0, and y0) define the region where the initial perturbations take place, vy is the velocity component along the jet axis, Ψ is the half-opening angle of the helix, and ω0 is the initial angular velocity.
The properties of the helix in this model are simply described by six parameters: four parameters (the initial angular velocity ω0 or, the initial spatial wavelength,  ; r0, φ0, and y0) describe the properties of the initial perturbations; and an additional two parameters (vy and Ψ) describe the properties of the jet in which the perturbation is propagated.
To fit the model to an observed jet trajectory, we need two more angular parameters to describe the projection of the 3-D jet trajectory on to the sky plane: θ the angle between the jet axis and the line-of-sight (or the viewing angle) and, α the position angle of the jet axis (defined as counter-clockwise from north).
We first assume that the perturbation takes place in a region close to the central engine, so that y0 can be set to zero for simplifying the calculations. The viewing angles of compact jet components calculated in Sect. 3.4 vary between 1.5° and 22.1°. If we include published data at lower observing frequencies in Hong et al. (2004), the arithmetic mean value of the viewing angles of compact jet components is 8.0°( ± 4.9). We take the mean value as an appropriate estimate of the viewing angle of the helix axis θ. The half-opening angle Ψ of 1156 + 295 is estimated to be ~3° (determined from the maxima range of the position angles and viewing angles of bright jet components).
Furthermore, we derived the jet velocity vj in Sect. 3.4. Since both the opening angle of the helix cone and the viewing angle of the jet are small, the velocity along the jet axis is approximately equal to the jet velocity, vy ≈ vj ~ 0.98 c. Taking into account of the effect in special relativity, the apparent jet velocity is boosted by a factor of  , i.e.,
  , or a proper motion of 0.19 mas yr-1.
The remaining four parameters (α, r0, φ0, λ) are the free parameters to be determined by fitting the model to the observed jet trajectory. As illustrated in Fig. 9, the observed jet trajectory can be well fitted with the isothermal helical jet model on wide scales ranging from 0.08 mas (0.6 pc) to 35 mas (250 pc). The symbols represent the jet components detected from the 15 and 43 GHz VLBI data from 2003 to 2005 presented in this paper, as well as the ones detected at 1.6, 22, and 86 GHz from other papers (Hong et al. 2004; Jorstad et al. 2001; Lee et al. 2008).
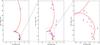 |
Fig. 9 The best fitting of a model with the fundamental helical mode in K-H instability (red curve) to the data (symbols). The color of symbols represents the data taken at different frequencies: blue for 15 GHz or lower frequencies, magenta for 22 GHz, red for 43 GHz, and green for 86 GHz. In addition, different types of symbol mark different jet components: star for C0, cross for C1, open circle for C2, open diamond for C3, open triangle for C4, open pentagram for C5, open hexagram for C6, and open square for C7. The components (B3, B2, C, D1) from Jorstad’s paper and (A1, A2) from Lee’s paper are marked with plus signs with red and pink, respectively. |
The best-fit model parameters are given in Table 8. The position angle α ≈ 2.6° in the source frame is inferred from our model fitting, and is consistent with the observed jet structure that extends northward from the core.
Parameters of the hydrodynamic instability model.
Our model fitting suggests that there is a region with r0 ≈ 0.005 mas (or ~0.04 pc) in which the jet flow might be perturbed substantially. This compact region in the vicinity of the central engine might be close to or associated with the jet nozzle. This radius (0.04 pc) is about 1000 times of the Schwarzschild radius (Rs ≈ 4 × 10⁻⁵ pc) of a supermassive black hole (SMBH) of 4.3 × 10⁸ M⊙ which has been inferred to exist in 1156 + 295 (Pian et al. 2005). It appears to be much greater than the inner edge of the accretion disk radius of 3 Rs, equivalent to the radius of the inner most stable orbit, but comparable to the typical size of the BLR. Perturbations in the jet flow might be imposed by the interactions between the jet plasma and BLR clouds.
We also examined the other cases considered by Steffen et al. (1995). In case 1, the specific angular momentum, the Lorentz factor, and the momentum component along the jet axis are assumed to be conserved. This case is rejected at first since no more than one quarter revolution can be produced for the helical pattern. Both cases 3 and 4 involve a magnetic field. case 4 takes into account the dissipation of the kinetic energy of the jet flow by means of collisions with the surrounding ISM and radiative losses, while case 3 considers the variation in the specific momentum. However, we found that the fitted curves in the models of both cases 3 and 4 degenerate quickly into a straight line on the scale of several milliarcsecs, inconsistent with the multiple jet bendings observed in 1156 + 295 on the scales ranging from mas to arcsecond.
4.2. Precessing jet
Alternatively, the observed helical jet morphology might represent a superposition of ballistic jet components ejected sequentially from a precessing jet nozzle (e.g. Stirling et al. 2003). On the basis of the assumption that the jet components are ejected from a precessing jet nozzle and move along ballistic paths, we fit the bright knots observed in the jet with a simple precessing model (Hjellming & Johston 1981; Baryshev 1983; An et al. 2010).
In this model, the jet knot moves outward from the central object with a constant velocity vj. The velocity vector vj rotates around the jet axis at an angle Ψ and a period P. Each jet component travels along a ballistic trajectory, and the projection of the superposition of their ballistic trajectories constitutes the observed helical jet trajectory on the sky plane. The angle between the jet axis and the line of sight is θ and the observed jet axis lies at a position angle α.
The velocity of a given jet can be described as in Hjellming & Johston (1981) with ![Mathematical equation: \begin{eqnarray} v_x&=&s_{\rm jet} v[\sin\Psi\cos\Omega(t-t_{\rm ref})\cos\theta+\cos\Psi\sin\theta], \\ v_y&=&s_{\rm jet} v\sin\Psi\sin\Omega(t-t_{\rm ref}), \\ v_z&=&s_{\rm jet} v[\cos\Psi\cos\theta-\sin\Psi\cos\Omega(t-t_{\rm ref})\sin\theta], \end{eqnarray}](/articles/aa/full_html/2011/05/aa16192-10/aa16192-10-eq207.png) where sjet is used to define the jet motion direction and sjet = + 1 corresponds to moving towards the observer, tref is the reference time, Ω is the rotating angular velocity of the jet velocity vector, Ω = srot2π/P, srot is used to define helix rotation direction, and srot = + 1 corresponds to counterclockwise.
where sjet is used to define the jet motion direction and sjet = + 1 corresponds to moving towards the observer, tref is the reference time, Ω is the rotating angular velocity of the jet velocity vector, Ω = srot2π/P, srot is used to define helix rotation direction, and srot = + 1 corresponds to counterclockwise.
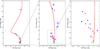 |
Fig. 10 The best fitting of the precessing-jet model (red curve) to the same observed data as described in Fig. 9. The color of symbols represents the data taken at different frequencies: blue for 15 GHz or lower frequencies, magenta for 22 GHz, red for 43 GHz, and green for 86 GHz. In addition, different types of symbol mark different jet components: star for C0, cross for C1, open circle for C2, open diamond for C3, open triangle for C4, open pentagram for C5, open hexagram for C6, and open square for C7. The components (B3, B2, C, D1) from Jorstad’s paper and (A1, A2) from Lee’s paper are marked with plus signs with red and pink, respectively. |
The transverse velocity of the jet can be decomposed into two orthogonal components of right ascension (α) and declination(δ)  Taking the relativistic aberration into account, the proper motion of a given component ejected at time teject on the sky plane can be written as:
  where d is the distance from the observer to the source.
A jet velocity vj ≥ 0.98c is derived in Sect. 3.4 in the source-rest frame. The jet half-opening angle Ψ of 3° and viewing angle of θ = 8° are the same as the values adopted in our K-H instability model (Sect. 4.1). Since the jet is moving toward us, sjet is set as + 1. Adopting an eyeball approach, we fit the precessing model to the jet structure observed on the parsec scale by adjusting the remaining free parameters (position angle of the helix α, precessing period P, reference time tref, and the sign of rotation srot).
The fitted parameters are given in Table 9. As illustrated in Fig. 10, on the scale of tens of mas, the precessing jet model provides a reasonable fit to the observed data but the inner 2-mas jet structure appears to be poorly fitted. The structure on the scale >35 mas is also difficult to fit with the precessing jet model. The kinematic model described here represents an ideal case, in which the jet is continuously ejected at a constant velocity and the jet ejection direction varies periodically. However, the actual jet precession in a powerful radio source might be more complex. For example, the period of the jet ejecting direction may be altered by intermittent radio outbursts and jet ejections (Reynolds & Begelman 1997). The jet may interact with the BLR and/or NLR clouds to generate stationary shocks. Abrupt changes in the jet direction and violent jet-ISM interactions have been observed in some compact-steep-spectrum sources such as 3C 48 (An et al. 2010) and 4C 41.17 (Gurvits et al. 1997). In addition, the intrinsically small jet bending in the inner 2 mas might be enhanced by projection effects. There is also a possibility that hydrodynamical instabilities of the plasma at the onset of the jet may modulate the fine structure of the whole curved jet.
Parameters of procession model.
A precessing jet from AGNs is a characteristic phenomenon in a binary black hole (BBH) system (Begelman 1980). However, the orbital period of the BBHs remains uncertain because the relationship between the precessing period and orbital period is unclear. Using the ratio of the precession period to the orbital period in X-ray binaries as an analogy (Margon et al. 1980), the precessing period fitted for 1156 + 295 gives a upper limit to the orbital period of the BBHs of about 95 years.
Assuming Keplerian motion, the derived semi-major axis, or the largest separation between the two black holes, is < 0.08 pc for a primary black hole with a mass of 4.3 × 10⁸ M⊙. This size scale is one tenth of the current VLBI resolution. Moreover, the real orbital period is probably a few percent of the precessing period, thus the orbital separation might be a few × 0.01 pc.
Some theoretical calculations (e.g. Yu 2002) show that the orbital parameters of a survival BBH depend on the galactic velocity dispersions and blackhole mass ratios. An orbital period of a few tens of years suggests a mass ratio of the secondary to primary black holes of between 0.01 and 0.05. Combining the close separation of the binaries and the relatively low mass of the secondary BH, the radio emission from the secondary BH might be very weak and below our current detectable limit in VLBI. Evidence of possible BBHs in 1156 + 295 may be represented by possible periodic variabilities in the radio, optical, and X-ray light curves, and the expected apparent variability timescale would be suppressed by relativistic aberration resulting in an orbital period much shorter than the intrinsic value (Yu 2002).
4.3. Comparison of the two models
In the hydrodynamic instability model, the jet trajectory on scales from sub-mas to several tens of mas and even larger can be naturally explained as the pattern produced by the fundamental mode (n = 1) or a helical mode in K-H instability model with an initial characteristic wavelength of λ0 = 0.2 mas (1.5 pc). On the basis of our model fitting to the data, the helical mode appears to be excited at the jet base on a scale of 0.005 mas or 10 , within the scope of the BLR. The emission from the jet knots moving towards the direction of observers is Doppler boosted. In comparison, the precessing jet model alone appears to have difficulty in fitting the jet trajectory on the observed scales ranging from sub-mas, several tens of mas, up to arcsec. In particular, the multiple bends observed on the mas scale cannot be explained solely with the precessing jet model. With additional mechanisms such as interactions of jet plasma with the interstellar medium, we may be able to explain the considerable deviation of the observed jet trajectory from that predicted in the precession jet model. Furthermore, the jet trajectory observed beyond 35 mas imposes a further limit on the precessing jet model using a single rotating angular velocity (Ω) of the precessing jet nozzle. To fit the precessing jet model to the data observed beyond 35 mas suggests that an additional rotating period (P = 2π/Ω), which is much longer than 95 years derived from the inner jet, is required. For 1156 + 295, despite the deceleration, the jet plasma on pc scales beyond 35 mas has been ejected from the jet nozzle for at most a few hundred years. It would be incredible if the period of a process associated with the nuclear dynamics had changed considerably and abruptly in such a short period. Finally, based on our VLA observations (Hong et al. 2004), the jet trajectory becomes a straight line on the kpc scale (or > 0.1 arcsec). In contrast, the precessing jet model predicts that the curvature of the jet trajectory projected on the sky becomes large unless ballistic jet components ejected from the precessing nozzle in a wide range of directions had been lined up, on the way travelling to the outer region on the kpc scale, by a tunnel in the ISM or by a poloidal magnetic field in 1156+295.
In short, although the results from our model fitting support the idea that the K-H instability is responsible for the observed helical jet pattern, we cannot fully rule out the possibility that the oscillating jet structure observed between 1 mas (10 pc) and 40 mas (300 pc) is driven by a precessing jet nozzle with a rotating period of 95 yr. Additional astrophysical processes (e.g. interaction between the jet plasma with the the BLR and/or NLR clouds) should be taken into account to explain the complex bending jet within 10 pc, and recollimation of the jet beyond 300 pc, if the jet precessing model is to be successfully applied to 1156 + 295.
5. Summary
We observed 1156 + 295 with the VLBA at the wavelengths of 86, 43, and 15 GHz with angular resolutions up to 0.08 mas (0.5 pc) at four discrete epochs during 2003 to 2005. Based on the analysis of the new VLBA data from the multiple-epoch and multiple-frequency observations, we have presented new results on the morphology, physical properties, and kinematics of the jet observed on the scales from sub-pc to pc from the blazar. We have also discussed the astrophysical implications for the helical pattern of the jet emission between sub-pc and kpc by fitting both the K-H instability model and the jet-nozzle precessing model to the observed data.
The core-jet structure was detected in 1156 + 295 at 43 and 15 GHz at angular resolutions from 0.2 mas to 0.6 mas. Six jet components were identified. Among the six, the innermost three were detected for the first time. The apparent transverse velocities of the six jet components range between 3.6 c and 11.6 c. At 86 GHz, during the first epoch the source was resolved into a core-jet structure on the image, during the last epoch the source seems to be resolved into a double-point source in the uv-domain, and during other epochs only a point-like source was detected on both the image and the uv-domain. Ultra-high apparent brightness temperatures of > 1012 K were inferred suggesting that highly relativistic jet plasma ejected from the nucleus moves in the directions close to the line-of-sight of observers. After correcting for both the Doppler beaming and cosmological redshift effects, the intrinsic brightness temperature of the nuclear radio emission is below the inverse Compton catastrophe limit. During the observing period from 2003 to 2005, a radio flare was present in the data, suggesting that a radio activity of the blazar originated inside. Linear polarization was detected at 43 and 15 GHz in both the core and inner jet. During the quiescent epochs, the EVPA of the jet polarized emission differed by ~ 35° from that of the core. No significant change in EVPA of the polarized emission from the core between 2 cm and 7 mm was observed during the quiescent epochs. At the epochs after the radio flare, EVPA observed at 7 mm from the core shows a significant change from that of the quiescent epoch.
By model fitting a helical fundamental mode of K-H instability and a precessing jet-nozzle, we have found that the K-H instability model successfully fits the observed jet trajectory on the scale ranging from sub-pc to kpc. Our results suggest that the fundamental helical mode with an initial characteristic wavelength of 0.2 pc appears to be excited at the jet base on a scale of 0.005 pc or 103Rs, a typical BLR size for a SMBH of 4.3 × 10⁸ M⊙. The precessing jet model only fits the jet trajectory observed on a scale ranging from 10 pc to 300 pc and requires additional astrophysical processes to explain the complex jet bending observed in the inner region (sub-pc to 10 pc) and the re-collimation of the large scale jet (>300 pc).
Acknowledgments
W.Z., X.Y.H., and T.A. are grateful for the support from the National Natural Science Foundation of PR China (NSFC10473018, 10503008), the Ministry of Science and Technology of China (Grant No. 2009CB824900/2009CB24903) and the eScience program “Fast eVLBI Imaging and dUT1 Determination” of the Chinese Academy of Sciences. W.Z. thanks Giuseppe Cimò for the help of calibration for the polarization VLBA data. W.Z. thanks JIVE for the hospitality during her visit to the Netherlands for the data reduction in 2007. The VLBA and VLA are instruments of the National Radio Astronomy Observatory, a facility of the US National Science Foundation operated under cooperative agreement by Associated Universities, Inc. This research has made use of data from the MOJAVE database that is maintained by the MOJAVE team (Lister et al. 2009, AJ, 137, 3718). This research uses the data from the University of Michigan Radio Astronomy Observatory which has been supported by the University of Michigan and by a series of grants from the National Science Foundation, most recently AST-0607523. The Owens Valley Radio Observatory Millimeter Array is supported in part of the National Science Foundation NSF Grant AST99-8154. Thanks are given to the anonymous referee for useful comments and suggestions, and Claire Halliday (language editor of A&A) for proof-reading of the text.
References
- An, T., Hong, X. Y., Hardcastle, M. J., et al. 2010, MNRAS, 402, 87 [NASA ADS] [CrossRef] [Google Scholar]
- Abdo, A. A., Ackermann, M., Ajello, M., et al. 2009, ApJ, 183, 146 [Google Scholar]
- Baryshev, Yu. V. 1983, Sov. Astro. Lett., 9 [Google Scholar]
- Begelman, M. C., Blandford, R. D., & Rees, M. J. 1980, Nature, 287, 301 [Google Scholar]
- Conway, J. E., & Murphy, D. E. 1993, ApJ, 411, 89 [NASA ADS] [CrossRef] [Google Scholar]
- Diamond, P. J. 1995, Very Long Baseline Interferometry and the VLBA, ed. Zeusus, J. A., Diamond, P. J., & Napier, P. J., ASP Conf. Ser., 82, 227 [Google Scholar]
- Fomalont, E 2004, error recognition and image analysis, Ninth Synthesis Imaging Summer School Socorro, June 15 − 22 [Google Scholar]
- Glassgold, A. E., Bregman, J. N., Huggins, P. J., et al. 1983, ApJ, 274, 101 [NASA ADS] [CrossRef] [Google Scholar]
- Ghisellini, G., Padovani, P., Celotti, A., & Maraschi, L. 1993, ApJ, 407, 65 [Google Scholar]
- Güijosa, A., & Daly, R. 1996, ApJ, 461, 600 [NASA ADS] [CrossRef] [Google Scholar]
- Gurvits, L. I., Schilizzi, R. T., Miley, G. K., et al. 1997, A&A, 318, 11 [NASA ADS] [Google Scholar]
- Hardee, P. E. 1979, ApJ, 234, 47 [NASA ADS] [CrossRef] [Google Scholar]
- Hardee, P. E. 1986, ApJ, 303, 111 [NASA ADS] [CrossRef] [Google Scholar]
- Hardee, P. E. 1987, ApJ, 318, 78 [NASA ADS] [CrossRef] [Google Scholar]
- Hardee, P. E. 2003, ApJ, 597, 798 [NASA ADS] [CrossRef] [Google Scholar]
- Hartman, R. C., Bertsch, D. L., Bloom, S. D., et al. 1999, ApJS, 123, 79 [NASA ADS] [CrossRef] [Google Scholar]
- Hjellming, R. M., & Johston, K. J. 1981, ApJ, 246, 141 [Google Scholar]
- Hong, X. Y., Jiang, D. R., Gurvits, L. I., et al. 2004, A&A, 417, 887 [NASA ADS] [CrossRef] [EDP Sciences] [Google Scholar]
- Kellermann, K. I., & Pailiny-Toth, I. I. K. 1969, ApJ, 155, 71 [Google Scholar]
- Jorstad, S. G., Marscher, A. P., Mattox, J. R., et al. 2001, ApJs, 134, 181 [Google Scholar]
- Lee, S. S., Lobanov, A. P., & Krichbaum, T. P. 2008, AJ, 136, 159 [NASA ADS] [CrossRef] [Google Scholar]
- Linfield, R. 1981, ApJ, 250, 464 [NASA ADS] [CrossRef] [Google Scholar]
- Liu, S., & Melia, F. 2002, ApJ, 573, L23 [NASA ADS] [CrossRef] [Google Scholar]
- Lobanov, A. P., Krichbaum, T. P., Graham, D. A., et al. 2000, A&A, 364, 391 [NASA ADS] [Google Scholar]
- Lobanov, A. P., Gurvits, L. I., Frey, S., et al. 2001, ApJ, 547, 714 [NASA ADS] [CrossRef] [Google Scholar]
- Lovell, J. E. J., Jauncey, D. L., Bignall, H. E., et al. 2003, AJ, 126, 1699 [NASA ADS] [CrossRef] [Google Scholar]
- McHardy, I. M., Marscher, A. P., Gear, W. K., et al. 1990, MNRAS, 246, 305 [NASA ADS] [Google Scholar]
- Margon, B., Grandi, S. A., & Downes, R. A. 1980, ApJ, 241, 306 [NASA ADS] [CrossRef] [Google Scholar]
- Marscher, A. P. 1995, PNAS, 92, 11439 [CrossRef] [Google Scholar]
- Mukherjee, R., Bertsch, D. L., Bloom, S. D., et al. 1997, ApJ, 490, 116 [NASA ADS] [CrossRef] [Google Scholar]
- Pian, E., Falomo, R., & Treves, A. 1995, MNRAS, 361, 919 [Google Scholar]
- Piner, B. G., & Kingham, K. 1997, ApJ, 485, L61 [NASA ADS] [CrossRef] [Google Scholar]
- Pearson, T. J. 1995, Chapter 14, Very Long Baseline Interferometry and the VLBA ASP Conf. Ser., 82, ed. J. A. Zensus, P. J. Diamond, & Napier [Google Scholar]
- Pearson, T. J., Browne, I. W. A., Henstock D. R., et al. 1998, Radio Emission from Galactic and Extragalactic Compact Sources, ed. J. A. Zensus, G. B. Taylor, & J. M. Wrobel, IAU Colloq., 164, ASP Conf. Ser., 144, 17 [Google Scholar]
- Readhead, A. C. S. 1994, ApJ, 426, 59 [NASA ADS] [Google Scholar]
- Reynolds, C. S., & Begelman, M. C. 1997, ApJ, 487, L135 [NASA ADS] [CrossRef] [Google Scholar]
- Sault, R. J., Teuben, P. J., & Wright, M. C. H. 1995, ASPC, 77, 433 [Google Scholar]
- Savolainen, T., & Kovalev, Y. Y. 2008, A&A 489, L33 [Google Scholar]
- Shepherd, M. C., Pearson, T. J., & Taylor, G. B. 1994, BAAS, 26,987 [NASA ADS] [Google Scholar]
- Steffen, W., Zensus, J. A., & Krichbaum, T. P. 1995, A&A, 302, 335 [Google Scholar]
- Stirling, A. M., Cawthorne, T. V., Stevens, J. A., et al. 2003, MNRAS, 341, 405 [NASA ADS] [CrossRef] [Google Scholar]
- Taylor, G. B., Vermeulen, R. C., Readhead, A. C. S., et al. 1996, ApJS, 107, 37 [NASA ADS] [CrossRef] [Google Scholar]
- Thomposon, D. J., Bertsch, D. L., Dingus, B. L., et al. 1995, ApJS, 101, 259 [Google Scholar]
- Urry, C. M., & Padovani, P. 1995, PASP, 107, 803 [NASA ADS] [CrossRef] [Google Scholar]
- Wills, B. J., Wills, D., Breger, M., Antonucci, R. R., & Barvainis, R. E. 1983, ApJ, 274, 62 [NASA ADS] [CrossRef] [Google Scholar]
- Wills, B. J., Wills, D., Breger, M., Antonucci, R. R. J., & Barvainis, R. 1992, ApJ, 398, 454 [NASA ADS] [CrossRef] [Google Scholar]
- Wright, E. L. 2006, PASP, 118, 1711 [NASA ADS] [CrossRef] [Google Scholar]
- Yu, Q. J. 2002, MNRAS, 331, 935 [NASA ADS] [CrossRef] [Google Scholar]
- Zensus, J. A., Cohen, M. H., Baath, L. B., & Nicolson, G. D. 1988, Nature, 334, 410 [NASA ADS] [CrossRef] [Google Scholar]
- Zhao, J.-H., Burns, J. O., Norman, M. L., & Sulkanen, M. E. 1992, ApJ, 387, 83 [NASA ADS] [CrossRef] [Google Scholar]
All Tables
All Figures
|
Fig. 1 The four epochs of VLBA images of 1156 + 295 at 15 GHz. The contour maps represent Stokes I images. The pseudo-color maps overlaid on contours represent the distribution of fractional polarization in which linear polarization intensity above 4σ is shown. The length of the short bars represents the strength of the polarized emission, 1 mas ~ 1.0 × 10⁻² Jy beam-1. The orientation of the short bars represent the apparent electric vector position angle (EVPA) without a rotation measure correction. The detailed parameters of the images are listed in Tables 2 and 7. |
| In the text | |
|
Fig. 2 The four epochs of VLBA images of 1156 + 295 at 43 GHz. The contour and pseudo-color maps are similar to those in Fig. 1. The length of the short bars represents the strength of polarized emission, 1 mas ~ 4.0 × 10⁻² Jy beam-1. The orientation of the short bars present the apparent EVPA without rotation measure correction. The detailed parameters of the images are listed in Tables 2 and 7. |
| In the text | |
|
Fig. 3 The fitted models are overlaid on the clean images of 15 and 43 GHz on epoch 2003.36 to indicate their positions and intrinsic size. |
| In the text | |
|
Fig. 4 Estimating the flux density (Sf) and size (θd) of the source using the brightness distribution models introduced by Pearson (1995): for the first three epochs, an extended source model could be used, whereas for the last epoch, a double-point source model with an intensity ratio of 3:1 and an angular separation of 0.16 mas were used. |
| In the text | |
|
Fig. 5 The four epochs VLBA images of 1156 + 295 at 86 GHz. The detailed parameters of the images are listed in Table 6. |
| In the text | |
|
Fig. 6 A spectral plot of the core component at the four epochs. The error bars show errors in the measurement of the flux density of the core component. |
| In the text | |
|
Fig. 7 The proper motions of the outer jet components C2, C3, and C4 are 0.49 ± 0.03 mas yr-1, 0.41 ± 0.08 mas yr-1, and 0.18 ± 0.03 mas yr-1, which correspond to 11.6 ± 0.7 c, 9.7 ± 1.9 c, and 4.3 ± 0.7 c, respectively. |
| In the text | |
|
Fig. 8 The proper motions of inner jet components C5, C6, and C7 are 0.15 ± 0.02 mas yr-1, 0.19 ± 0.02 mas yr-1, and 0.16 ± 0.04 mas yr-1, which correspond to 3.6 ± 0.5 c, 4.5 ± 0.5 c, and 3.8 ± 0.9 c, respectively. |
| In the text | |
|
Fig. 9 The best fitting of a model with the fundamental helical mode in K-H instability (red curve) to the data (symbols). The color of symbols represents the data taken at different frequencies: blue for 15 GHz or lower frequencies, magenta for 22 GHz, red for 43 GHz, and green for 86 GHz. In addition, different types of symbol mark different jet components: star for C0, cross for C1, open circle for C2, open diamond for C3, open triangle for C4, open pentagram for C5, open hexagram for C6, and open square for C7. The components (B3, B2, C, D1) from Jorstad’s paper and (A1, A2) from Lee’s paper are marked with plus signs with red and pink, respectively. |
| In the text | |
|
Fig. 10 The best fitting of the precessing-jet model (red curve) to the same observed data as described in Fig. 9. The color of symbols represents the data taken at different frequencies: blue for 15 GHz or lower frequencies, magenta for 22 GHz, red for 43 GHz, and green for 86 GHz. In addition, different types of symbol mark different jet components: star for C0, cross for C1, open circle for C2, open diamond for C3, open triangle for C4, open pentagram for C5, open hexagram for C6, and open square for C7. The components (B3, B2, C, D1) from Jorstad’s paper and (A1, A2) from Lee’s paper are marked with plus signs with red and pink, respectively. |
| In the text | |
Current usage metrics show cumulative count of Article Views (full-text article views including HTML views, PDF and ePub downloads, according to the available data) and Abstracts Views on Vision4Press platform.
Data correspond to usage on the plateform after 2015. The current usage metrics is available 48-96 hours after online publication and is updated daily on week days.
Initial download of the metrics may take a while.