Fig. 1
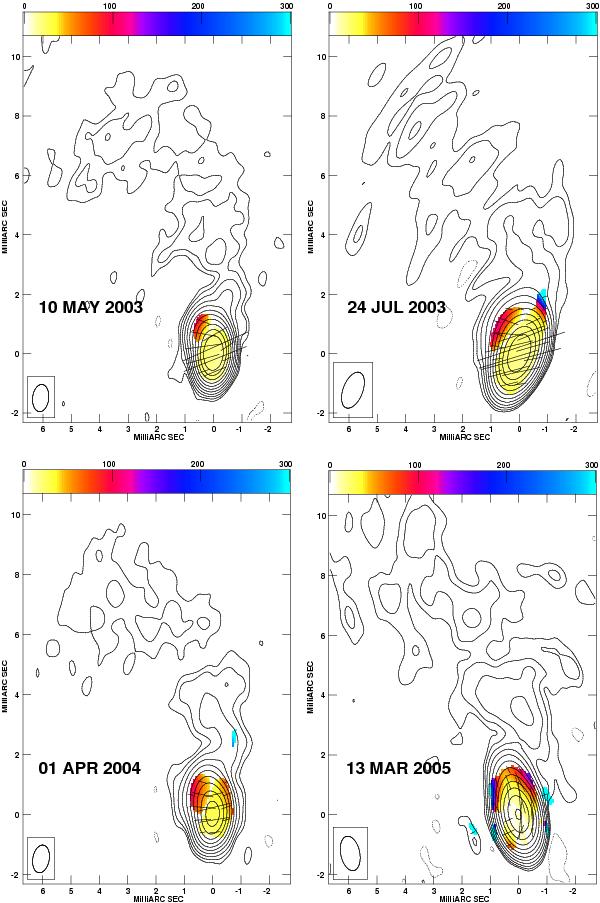
The four epochs of VLBA images of 1156 + 295 at 15 GHz. The contour maps represent Stokes I images. The pseudo-color maps overlaid on contours represent the distribution of fractional polarization in which linear polarization intensity above 4σ is shown. The length of the short bars represents the strength of the polarized emission, 1 mas ~ 1.0 × 10⁻² Jy beam-1. The orientation of the short bars represent the apparent electric vector position angle (EVPA) without a rotation measure correction. The detailed parameters of the images are listed in Tables 2 and 7.
Current usage metrics show cumulative count of Article Views (full-text article views including HTML views, PDF and ePub downloads, according to the available data) and Abstracts Views on Vision4Press platform.
Data correspond to usage on the plateform after 2015. The current usage metrics is available 48-96 hours after online publication and is updated daily on week days.
Initial download of the metrics may take a while.